|
|
VOL 7 | NUM 48 | 9 June 2025
|
|
|
|
|
|
|
|
MEXICO - SIN | 25 - 31 May 2025
|
|
|
|
Power Markets Weekly
is a brief weekly review of the electric market operation in Chile, Mexico, Iberia, France and Italy. If you are not a subscriber, please feel free to subscribe
here
|
|
|
|
|
|
DNV offers tools for Wholesale Market analysis and operation:
- DNV Power Analytics (DNV-PA) is our web-based platform that provides access to constantly updated long-term energy price forecasts.
- With a refined design and an improved user experience we are upgrading our digital services for our customers.
|
|
|
|
|
|
|
Joint Decrease in LMP, Demand, and Fuel Prices
|
|
|
|
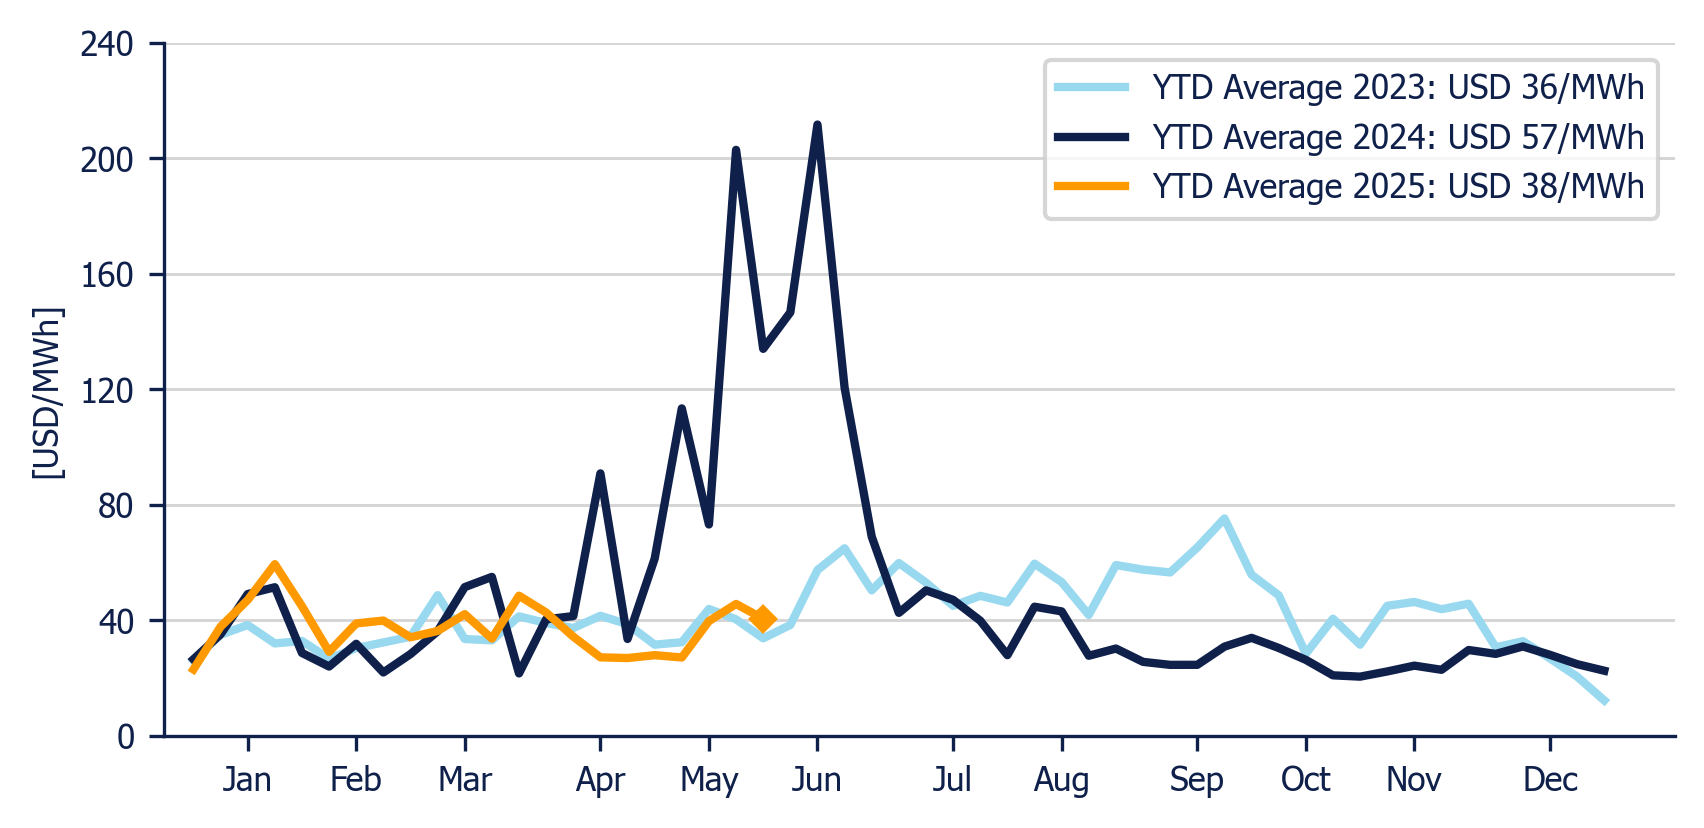
The Energy Component weekly average in the Day-Ahead Market (MDA) decreased to USD 41/MWh.
|
|
The Energy Component was 11% and 69.7% lower than the previous week and than the same week in 2024, respectively.
|
|
The highest Day-Ahead Market LMP (Local Marginal Price) was recorded in Xcalacoco (Peninsular) at USD 824/MWh, while the lowest was recorded in Valle de Mexico Maniobras (Center) at USD -48.73/MWh.
|
|
Energy Component of the National Interconnected System - Weekly average
|
|
|
|
|
|
|
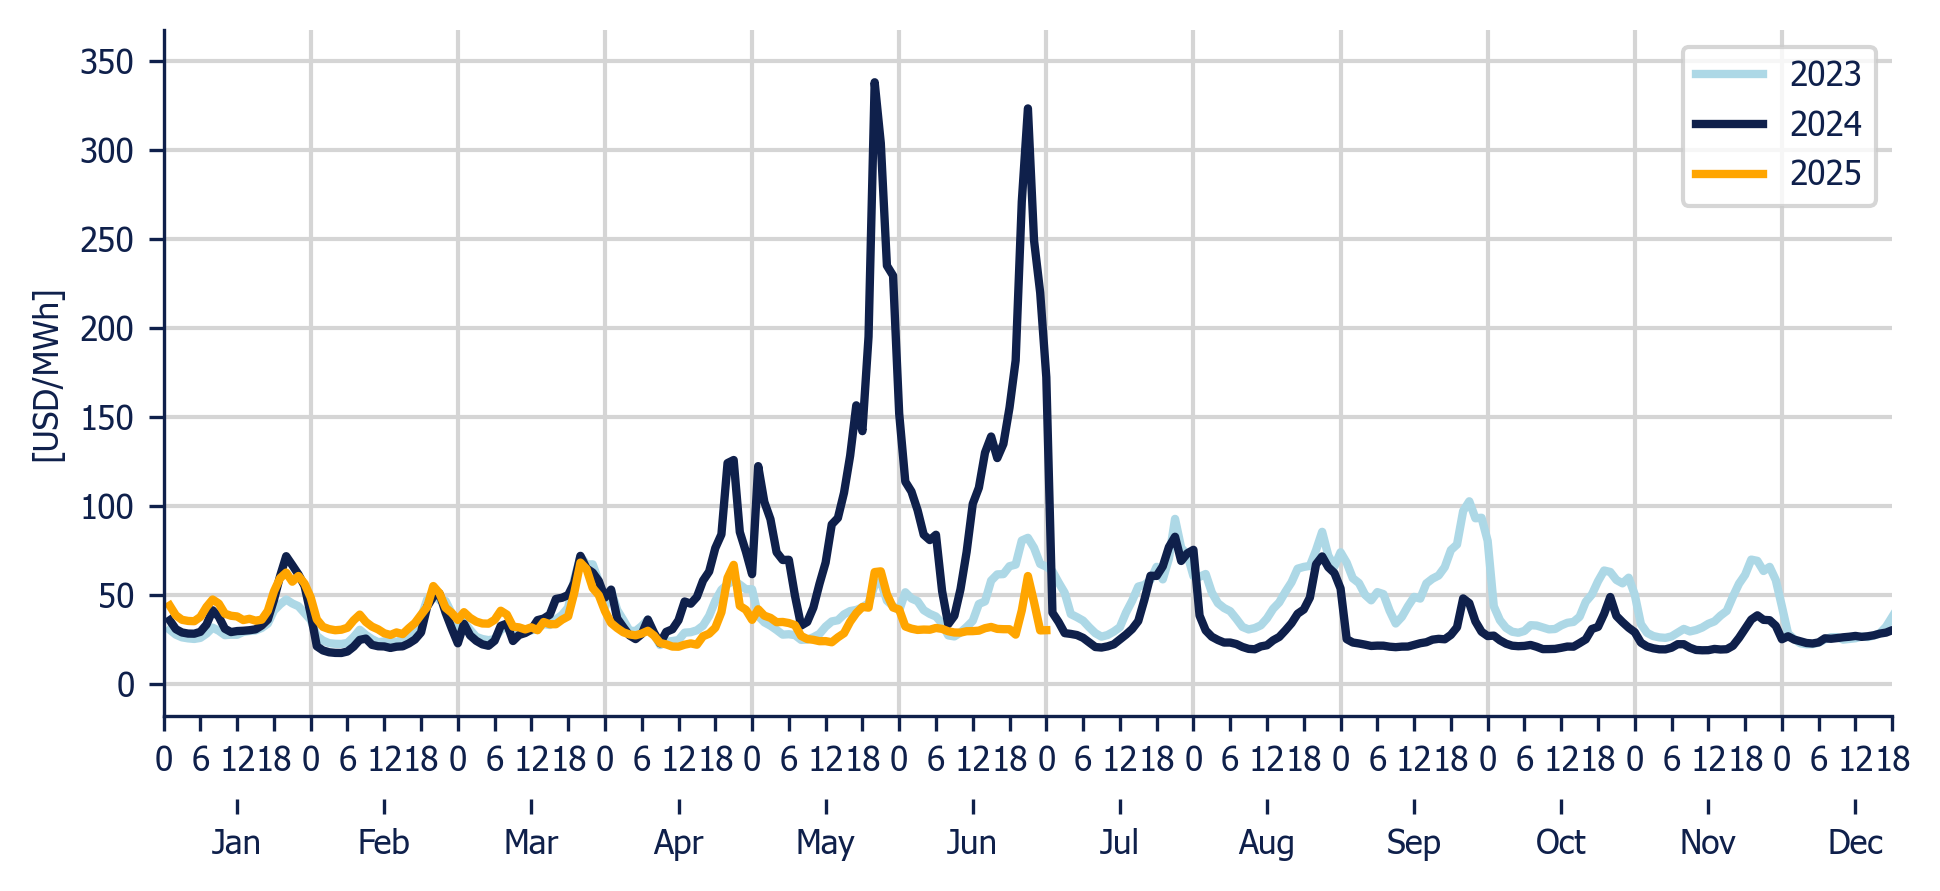
Energy Component of the National Interconnected System - Hourly average per month
|
|
|
|
|
|
|
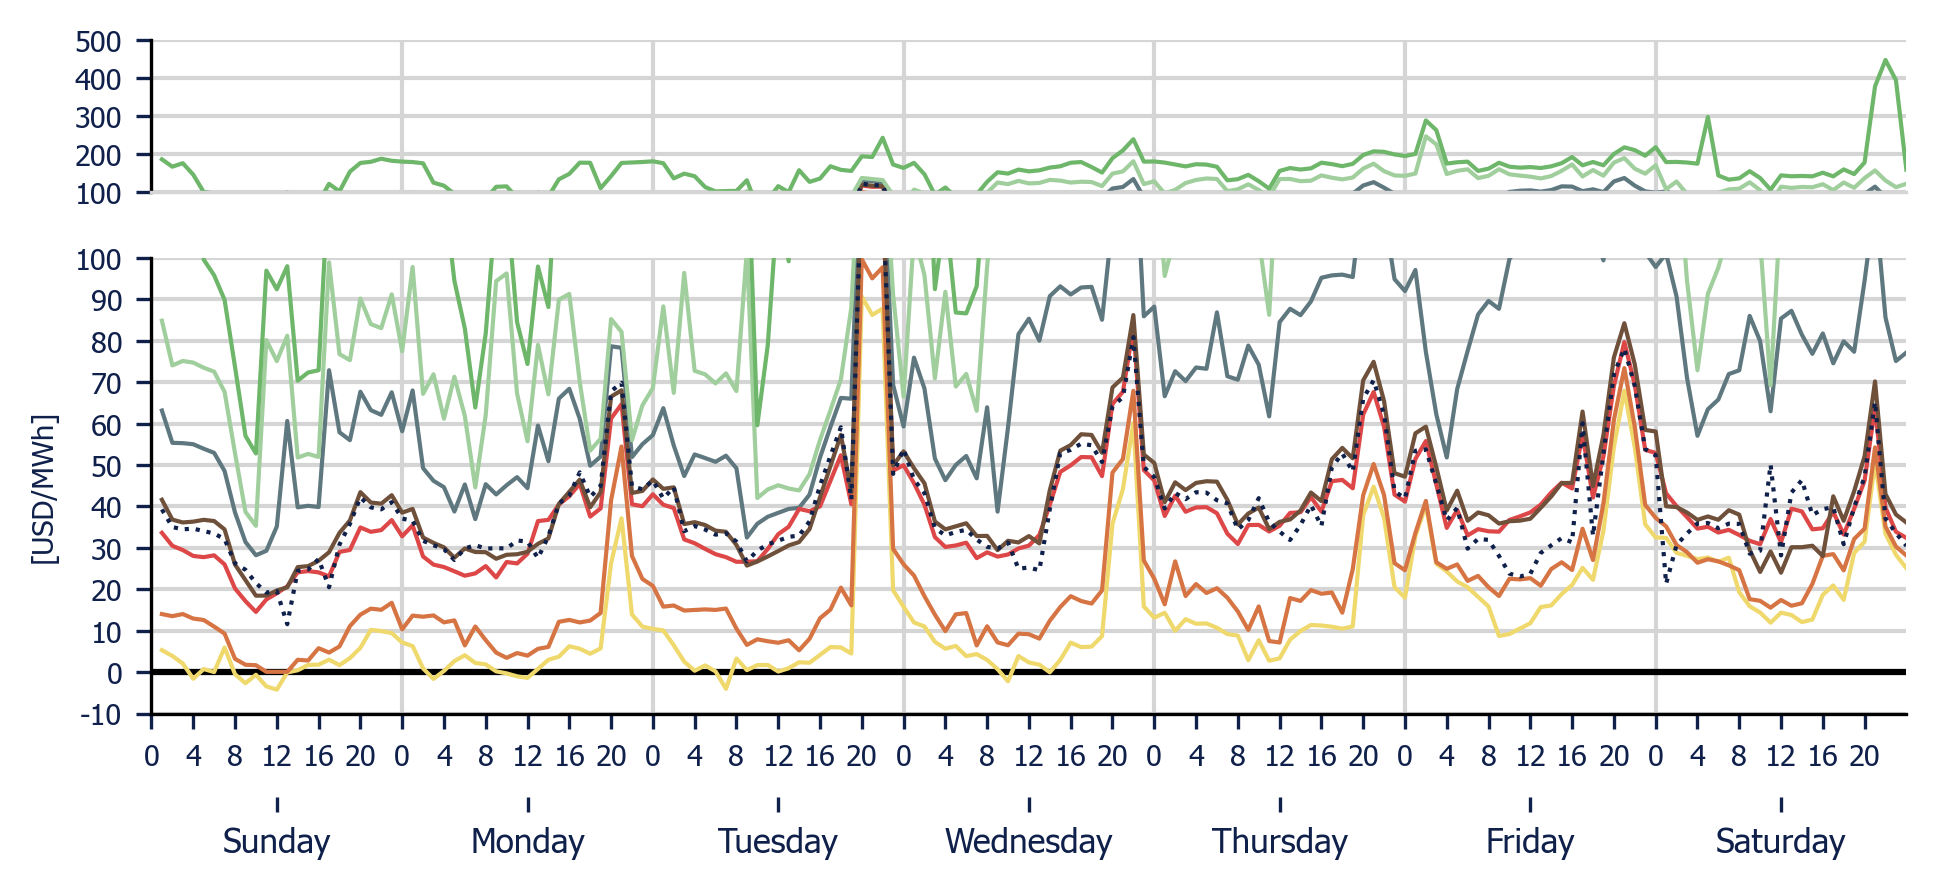
The Energy Component ranged between USD 11.56/MWh and USD 121.34/MWh. The weekly LMP decreased by 11% compared to the previous week, remaining within the 2023 range. Electricity demand broke its upward trend and showed a decline. The hourly monthly LMP for May remained above April levels. Two pricing zones were observed (north and central-south), with no significant congestion. Renewable generation decreased, while hydro increased, and non-dispatchable sources had the highest contribution.
|
|
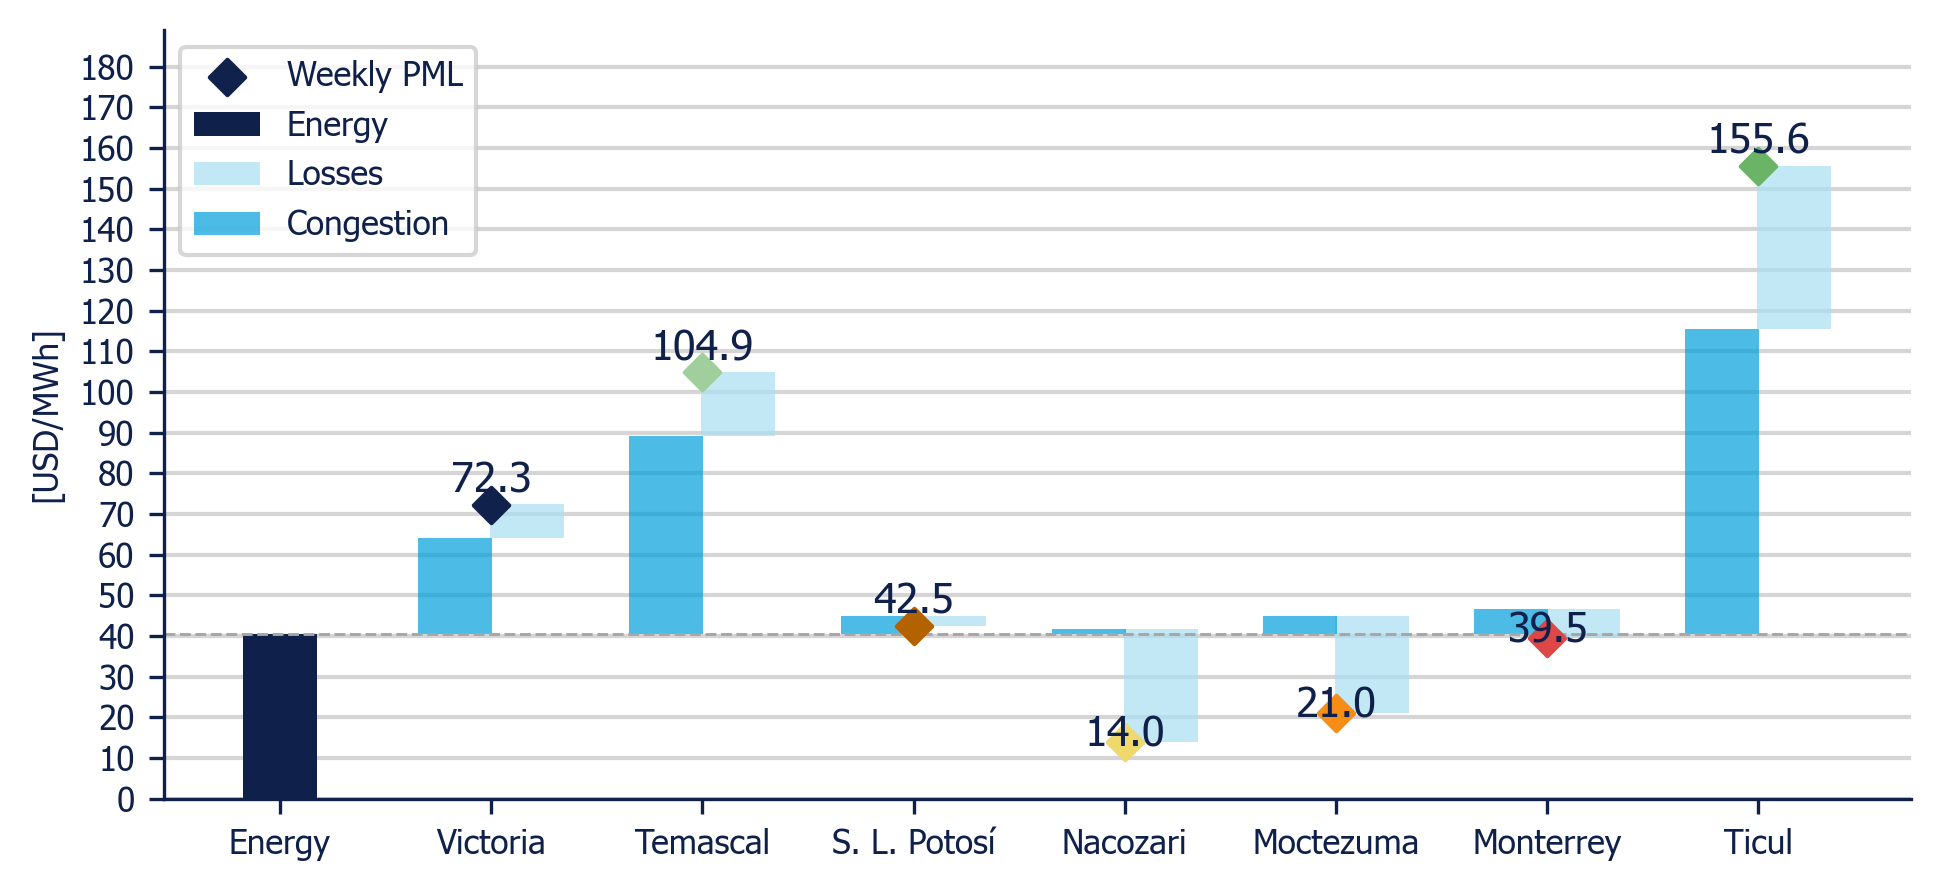
The trend of the PMLs in each reference node is represented below in percentage difference (%) from the weekly average of the Energy Component:
|
- Central (Victoria) +78.3%
- Northeast (Monterrey) -2.6%
- Northwest (Nacozari) -65.4%
- North (Moctezuma) -48.2%
- West (San Luis Potosi) +4.8%
- East (Temascal) +158.7%
- Peninsular (Ticul) +283.6%
|
|
Weekly evolution of Local Marginal Price (PML) in 7 reference nodes (MDA)
|
|
|
|
|
|
|
Victoria
USD 72.3/MWh
|
|
Monterrey
USD 39.5/MWh
|
|
Nacozari
USD 14.0/MWh
|
|
Moctezuma
USD 21.0/MWh
|
|
|
S. L. Potosí
USD 42.5/MWh
|
|
Temascal
USD 104.9/MWh
|
|
Ticul
USD 155.6/MWh
|
|
Energy Component
USD 40.6/MWh
|
|
|
|
|
|
Weekly Average PML Components in 7 reference nodes (MDA)
|
|
|
|
|
|
|
Hours
|
Transmission Link
|
Region
|
|
144.0
|
Teotihuacan - Texcoco
|
Central
|
|
138.0
|
Enlace Cozumel
|
Peninsular
|
|
75.0
|
Tapachula - Los Brillantes
|
East
|
|
70.0
|
Los Mochis - Guamuchil
|
Northwest
|
|
60.0
|
Escarcega 400 KV - Escarcega 230-115 KV
|
Peninsular
|
|
52.0
|
Dzitnup - Riviera Maya
|
Peninsular
|
|
51.0
|
Sonora Norte - Juarez
|
North
|
|
|
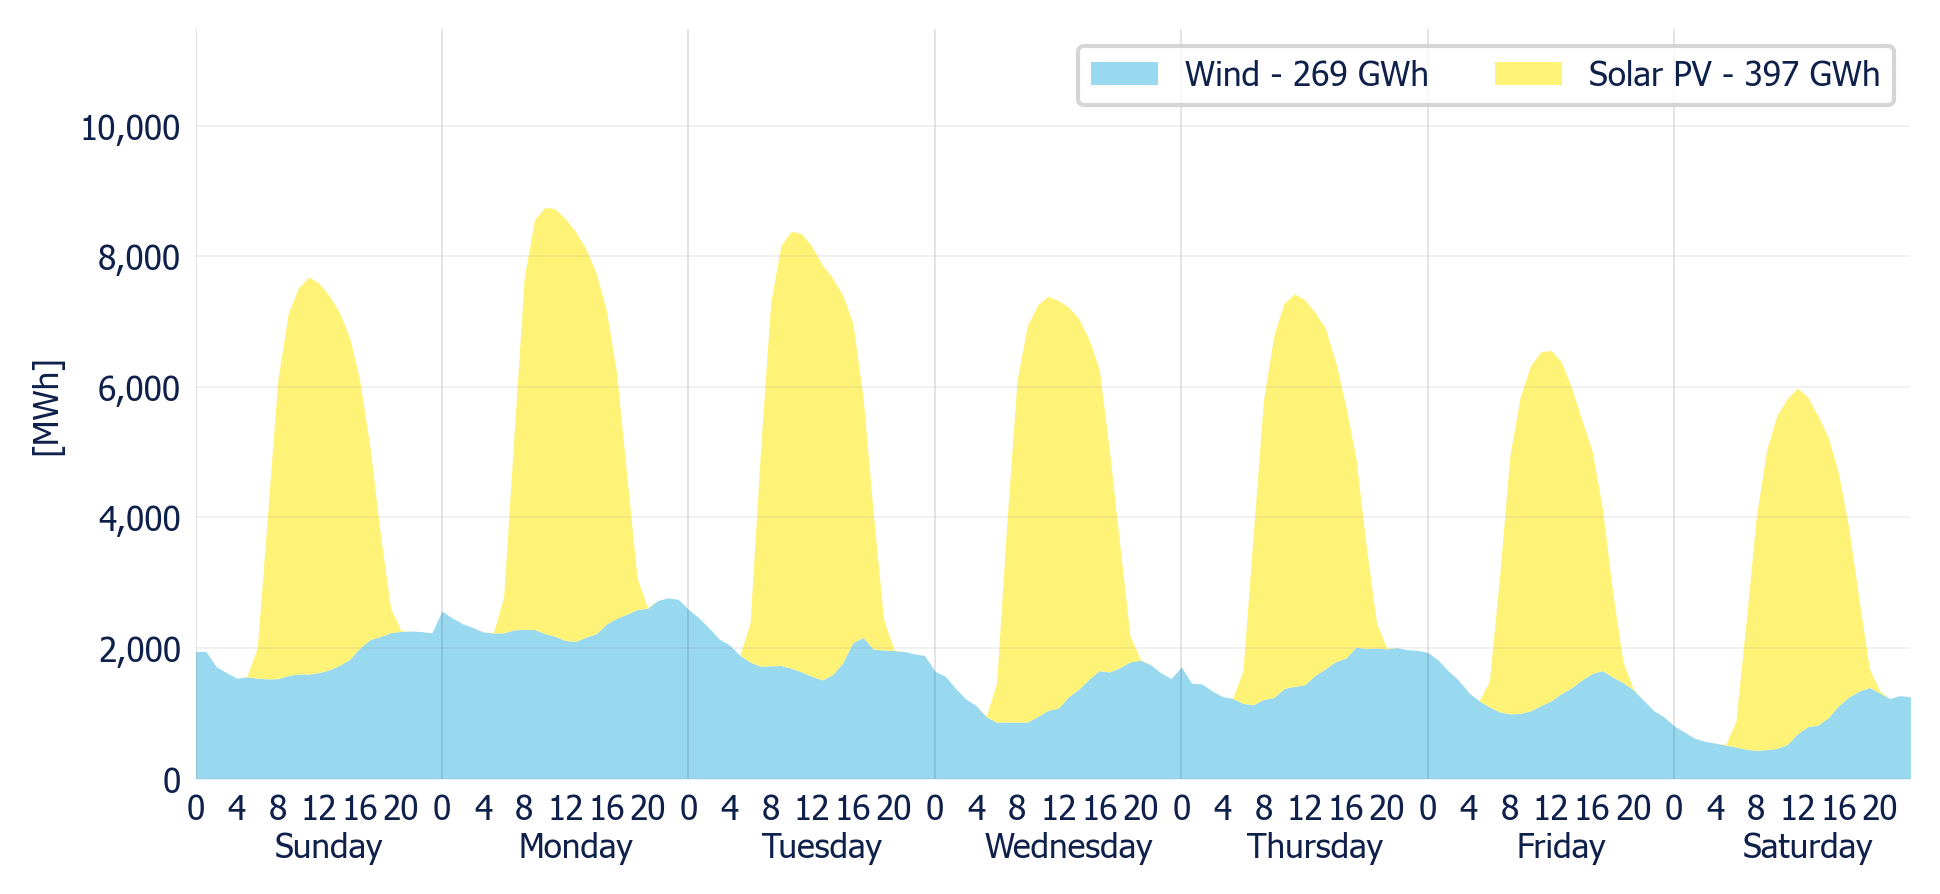
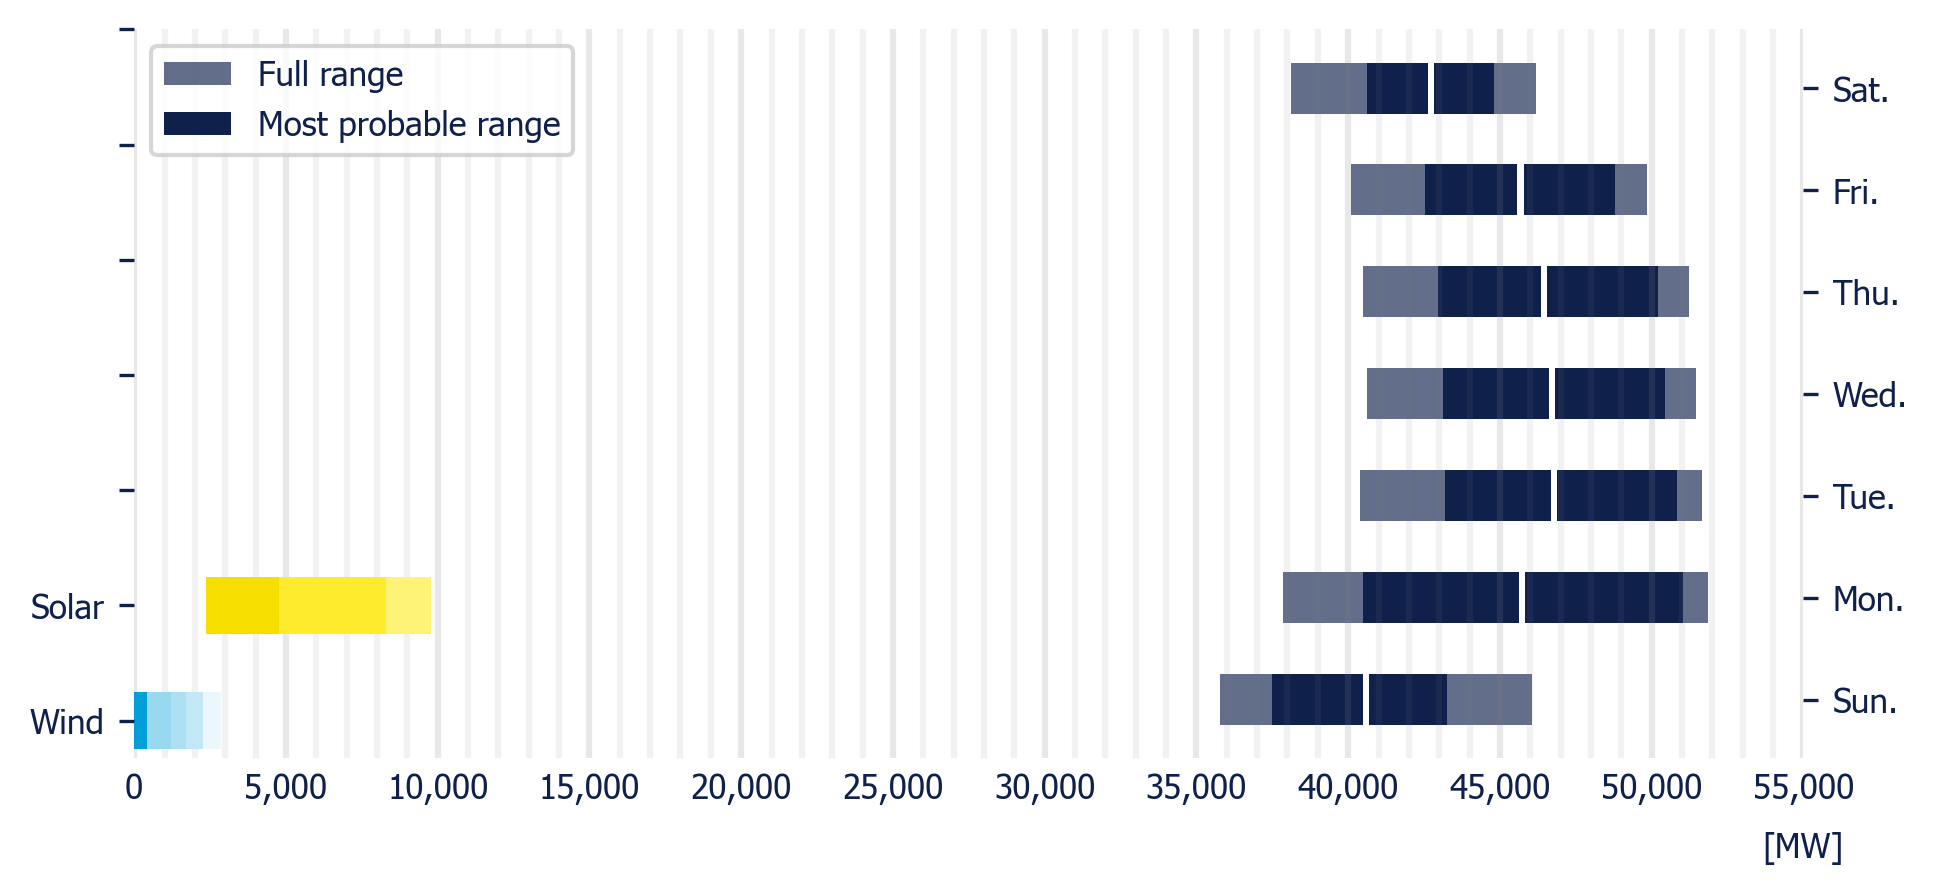
Wind generation forecast decreased compared to the previous week by 55.94 GWh (-19.5%). The same pattern was followed by solar generation forecast, with a decrease of 54.36 GWh, compared to last week (-13.5%).
|
|
Wind captured price was USD 0.4/MWh higher than the Energy Component, while solar captured price was USD 6.3/MWh lower than the Energy Component.
|
|
Wind & Solar generation forecast for the SIN (MDA)
|
|
|
|
|
|
Solar PV Price*
|
Wind Price*
|
|
|
|
|
|
|
*Energy weighted average LMP, using LMP in Victoria
|
|
|
|
|
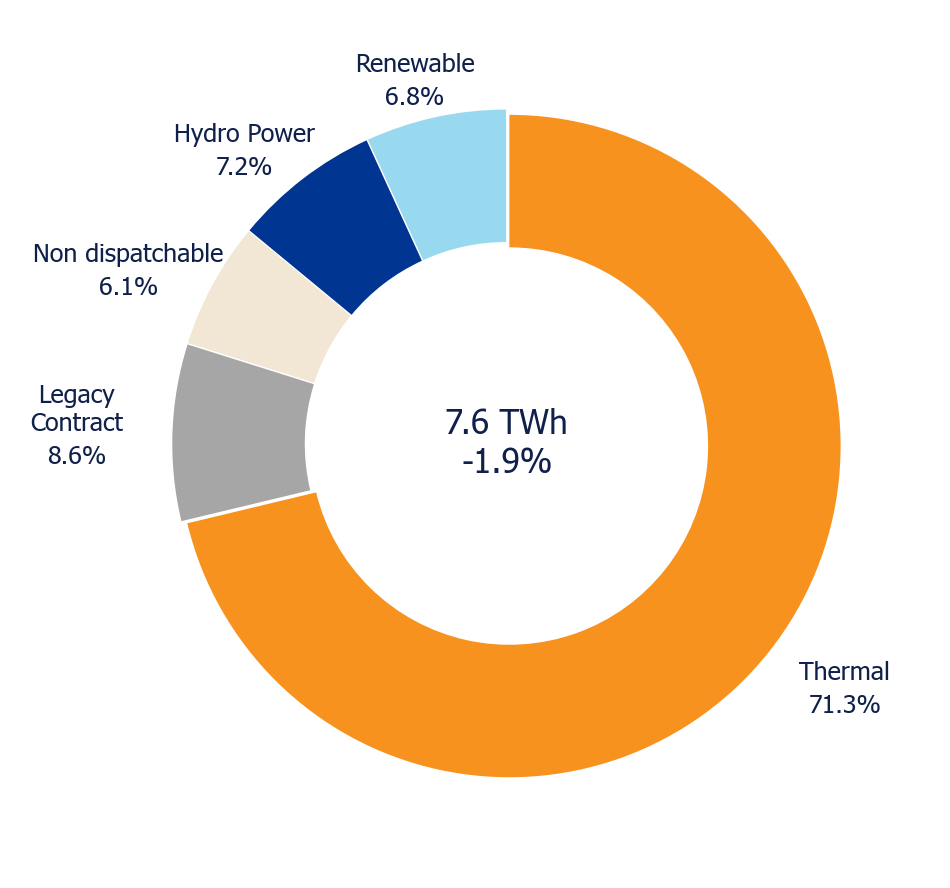
Weekly planned demand decreased by 1.3% from the previous week to 7.6 TW, while peak demand was 48.8 GW showing a decrease of 2.01% compared to the previous week.
|
|
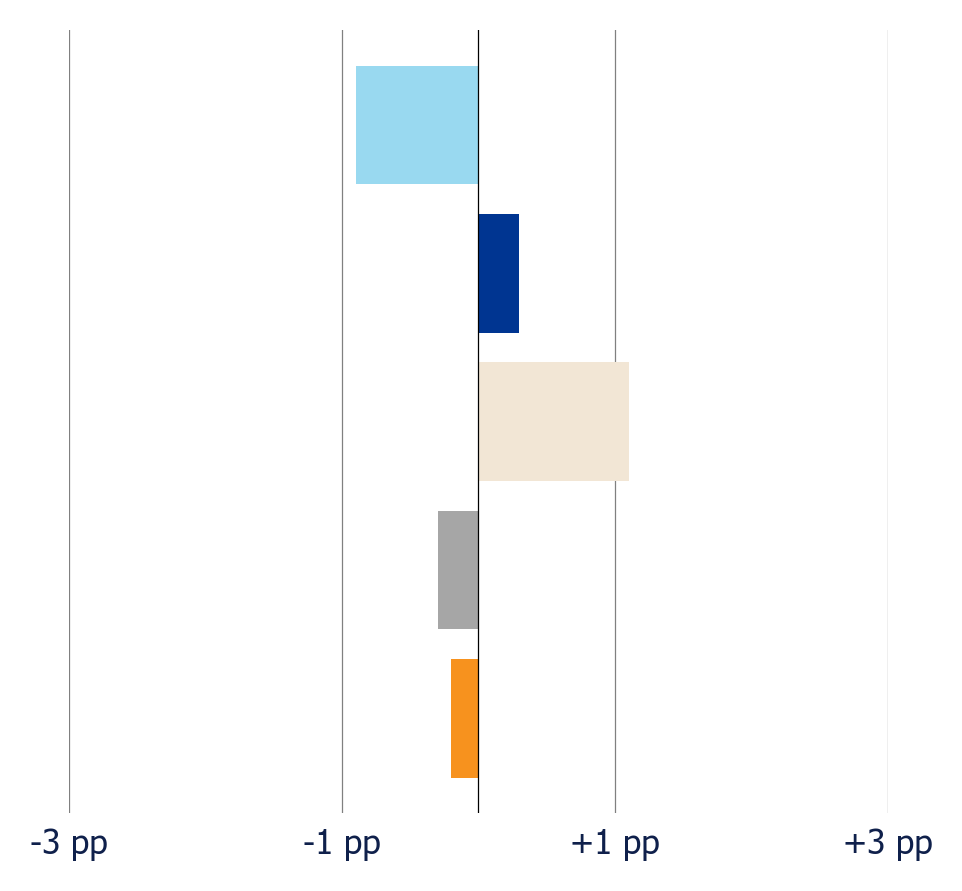
Shares of generation compared to the previous week were: Thermal -0.22 pp, Legacy Contract -0.28 pp, Non dispatchable +1.12 pp, Hydro Power +0.31 pp and Renewable -0.92 pp.
|
|
Planned generation mix
|
|
|
|
|
Planned variation
|
|
|
|
|
Planned demand in the MDA
|
|
|
|
|
|
|
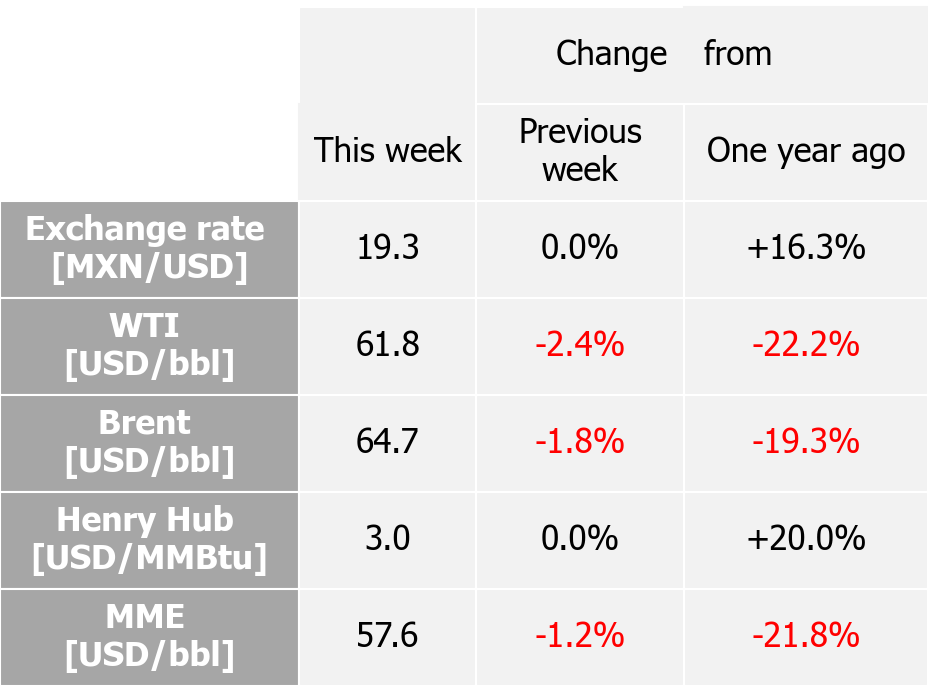
The MXN/USD exchange rate closed the week at 19.3 MXN/USD, identical to last week.
|
|
Henry Hub natural gas benchmark closed the week at an average of USD 3.03/MMBtu, decreasing by 0.59%. It is stablished that the rising temperatures in the USA have affected the natural gas prices.
|
|
WTI, Brent, and MME crude oil benchmarks prices were -2.3%, -1.7%, and -1.2% from the previous week, respectively, closing at USD 61.82/bbl., USD 64.74/bbl., and USD 57.58/bbl. There has been a drop in oil prices as OPEC+ is considering an increase in the oil output for July, beyond forecasts made previously. This represents a decrease in the price, as the oil production is expected to grow in the next month. Which have resulted in a decrease in Brent and WTI crude oil prices, as the OPEC+, which is the Organization of Petroleum Exporting Countries, expects a higher oil output in the short-medium term, as a result, the prices of WTI, Brent and MME is expected to decrease.
|
|
Map
|
|
|
|
|
International indexes
|
|
|
|
|
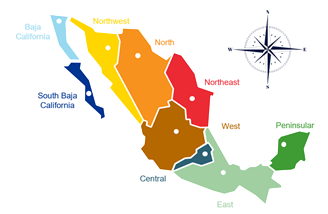
The nodes used for this report have been selected by DNV for their ability to represent the behavior of the different Control Regions within the SIN.
|
DNV, Insurgentes Sur 859, 03810 Ciudad de México, México
|
|
|
|
|
|
|