|
|
VOL 7 | NUM 47 | 2 June 2025
|
|
|
|
|
|
|
|
MEXICO - SIN | 18 - 24 May 2025
|
|
|
|
Power Markets Weekly
is a brief weekly review of the electric market operation in Chile, Mexico, Iberia, France and Italy. If you are not a subscriber, please feel free to subscribe
here
|
|
|
|
|
|
DNV offers tools for Wholesale Market analysis and operation:
- DNV Power Analytics (DNV-PA) is our web-based platform that provides access to constantly updated long-term energy price forecasts.
- With a refined design and an improved user experience we are upgrading our digital services for our customers.
|
|
|
|
|
|
|
Stability in Fuel Prices and Weekly Increases in Electricity Demand and LMP
|
|
|
|
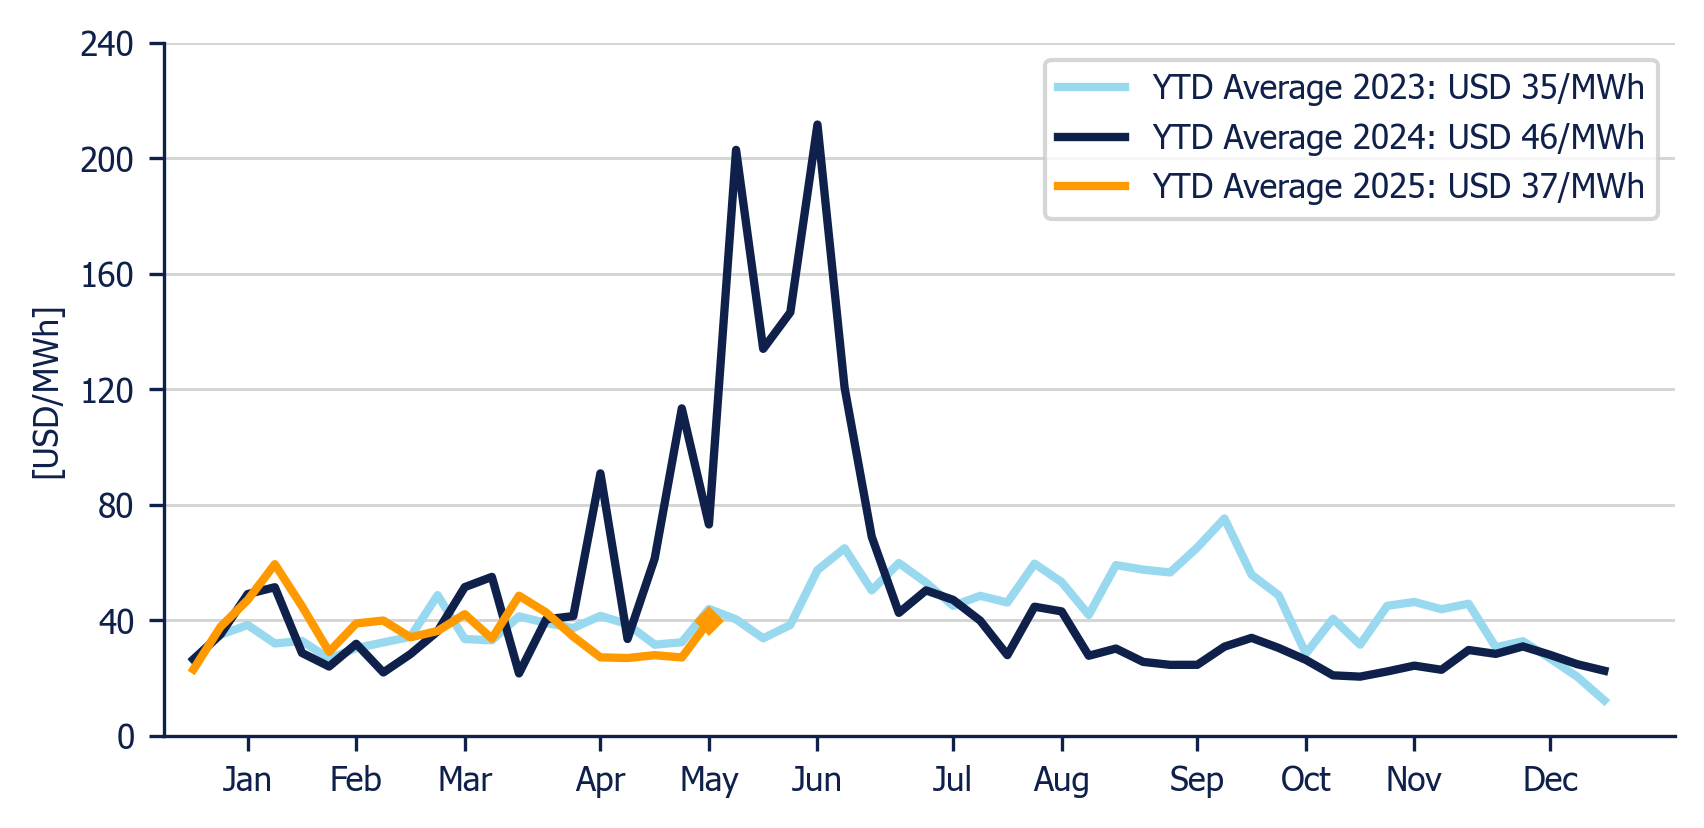
The Energy Component weekly average in the Day-Ahead Market (MDA) increased to USD 46/MWh.
|
|
The Energy Component was 15% higher from the previous week and 77.5% lower than the same week in 2024, respectively.
|
|
The highest Day-Ahead Market LMP (Local Marginal Price) was recorded in Xcalacoco (Peninsular) at USD 880/MWh, while the lowest was recorded in Teotihuacan (Center) at USD -127.92/MWh.
|
|
Energy Component of the National Interconnected System - Weekly average
|
|
|
|
|
|
|
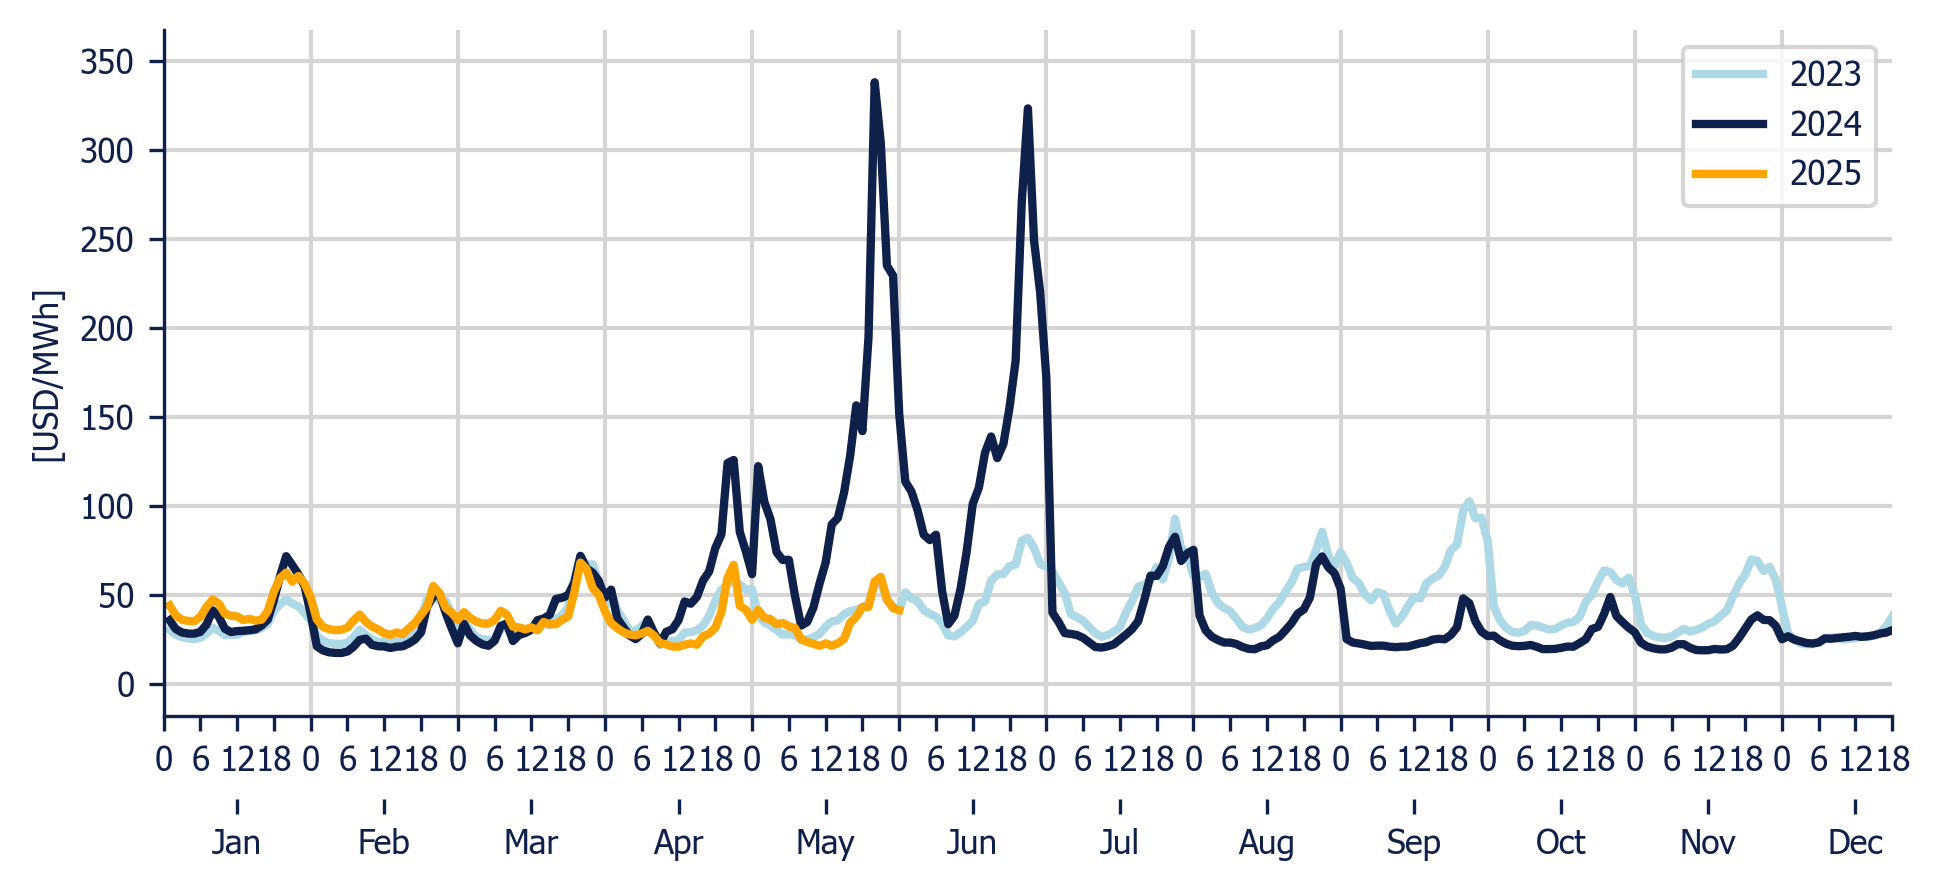
Energy Component of the National Interconnected System - Hourly average per month
|
|
|
|
|
|
|
The Energy Component ranged between USD 0/MWh and USD 118.33/MWh. During the third full week of May, the Local Marginal Price increased by 15% compared to the previous week, surpassing the levels recorded during the same period in 2023, while electricity demand continued to grow at a similar pace. The hourly monthly LMP has already exceeded the average hourly prices observed in April. Although congestion persisted in the Peninsular region, it was less severe than in previous weeks, and negative prices declined in the northern regions of the country. In the generation mix, the share of renewable energy decreased, while hydroelectric generation showed a recovery, slightly surpassing its contribution from the same period last year.
|
|
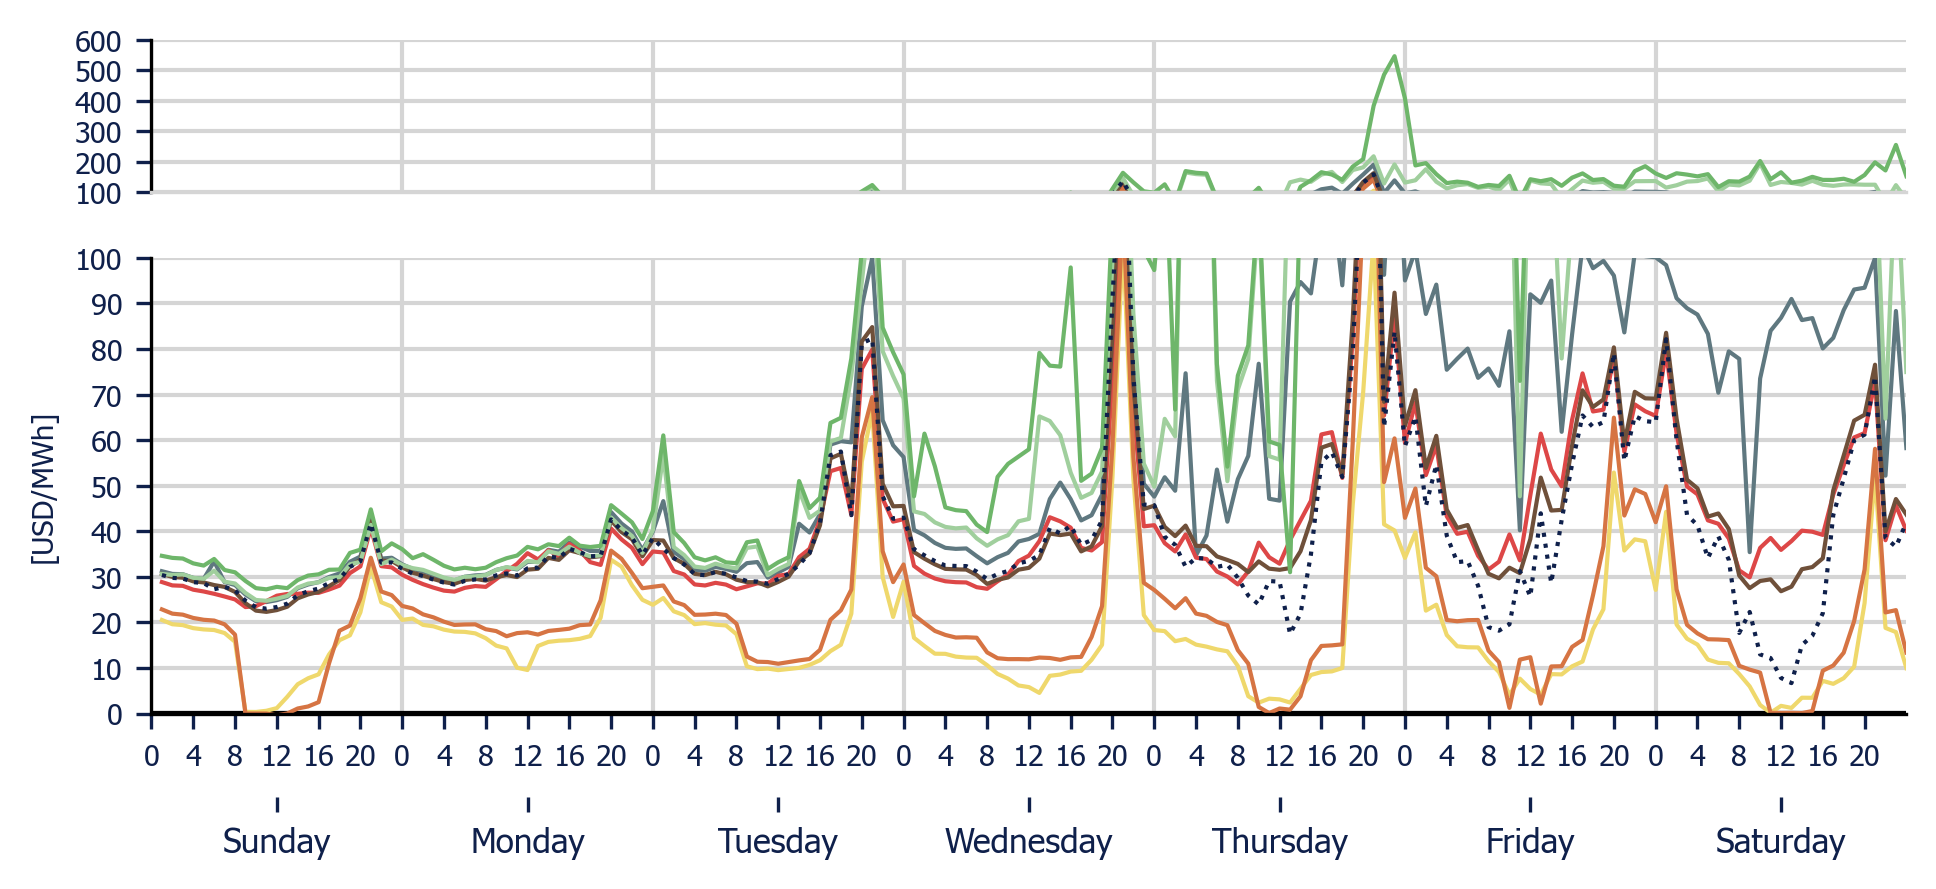
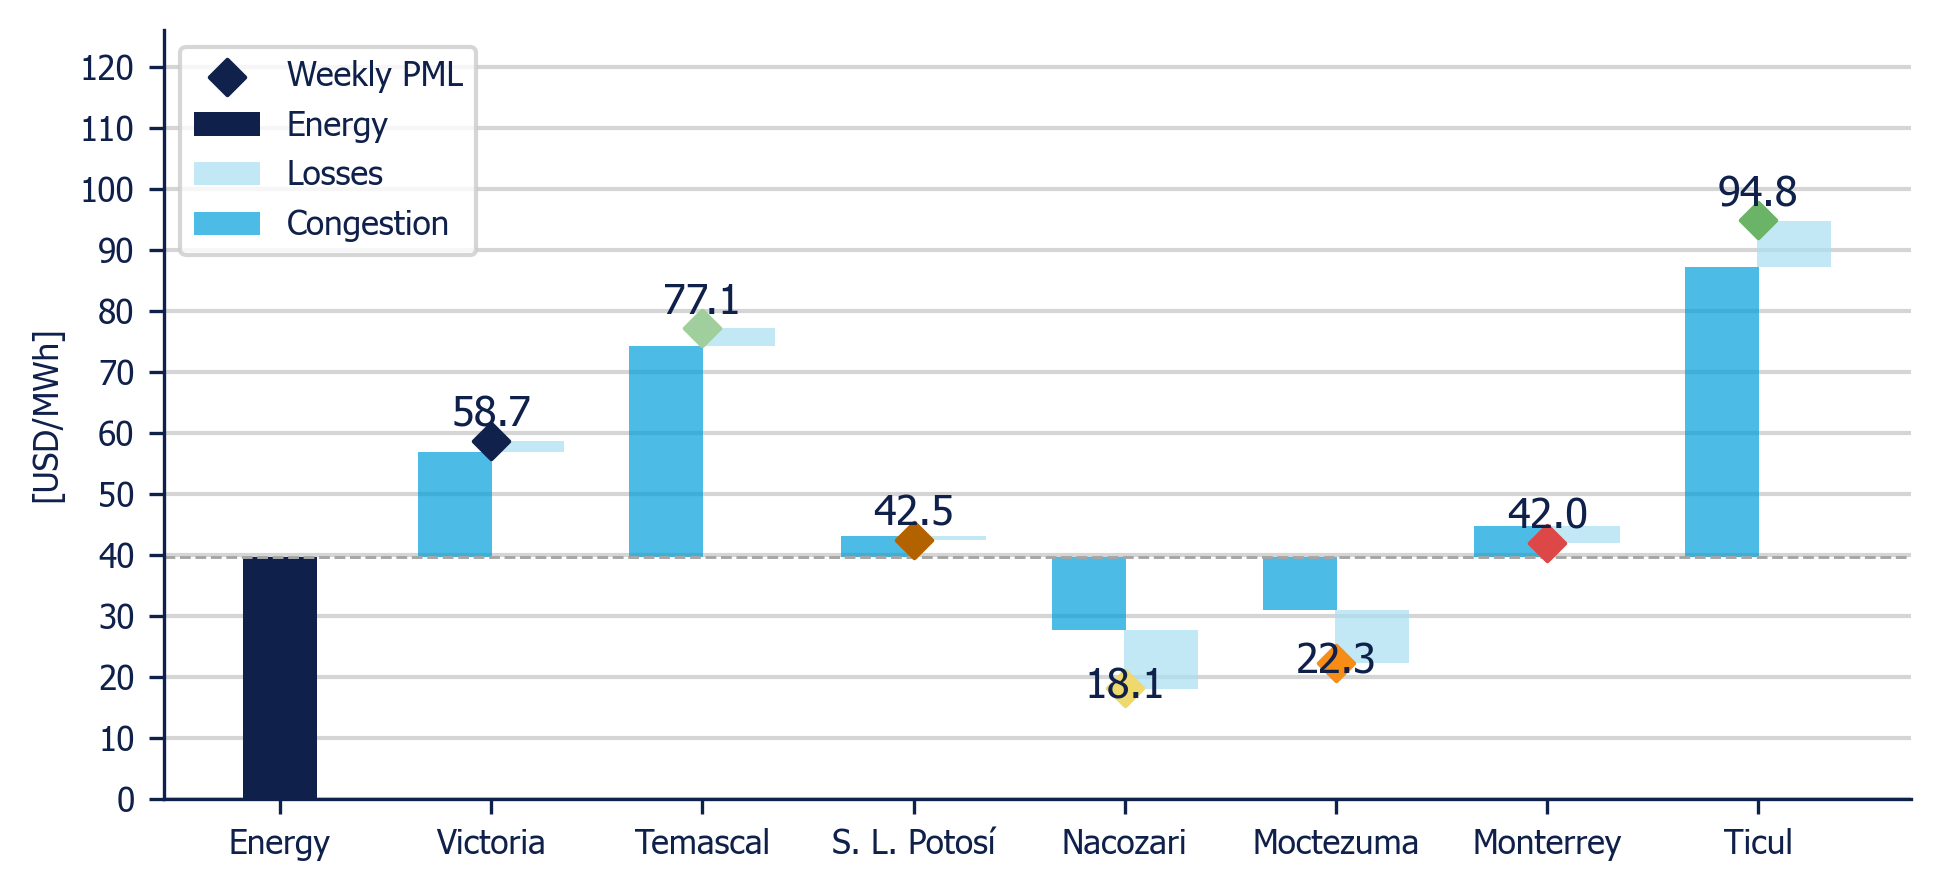
The trend of the PMLs in each reference node is represented below in percentage difference (%) from the weekly average of the Energy Component:
|
- Central (Victoria) +57.8%
- Northeast (Monterrey) +2.3%
- Northwest (Nacozari) -73.6%
- North (Moctezuma) -59.8%
- West (San Luis Potosi) +10.1%
- East (Temascal) +130.0%
- Peninsular (Ticul) +256.0%
|
|
Weekly evolution of Local Marginal Price (PML) in 7 reference nodes (MDA)
|
|
|
|
|
|
|
Victoria
USD 72.1/MWh
|
|
Monterrey
USD 46.7/MWh
|
|
Nacozari
USD 12.1/MWh
|
|
Moctezuma
USD 18.4/MWh
|
|
|
S. L. Potosí
USD 50.3/MWh
|
|
Temascal
USD 105.0/MWh
|
|
Ticul
USD 162.6/MWh
|
|
Energy Component
USD 45.7/MWh
|
|
|
|
|
|
Weekly Average PML Components in 7 reference nodes (MDA)
|
|
|
|
|
|
|
Hours
|
Transmission Link
|
Region
|
|
113.0
|
Teotihuacan - Texcoco
|
Central
|
|
77.0
|
Los Mochis - Guamuchil
|
Northwest
|
|
71.0
|
Chihuahua - Noreste + Camargo Dos - Gomez Palacio
|
North
|
|
55.0
|
Tapachula - Los Brillantes
|
East
|
|
51.0
|
Ciudad Industrial (Mexico) - Laredo Americano (USA)
|
Northeast
|
|
44.0
|
Escarcega 400 KV - Escarcega 230-115 KV
|
Peninsular
|
|
|
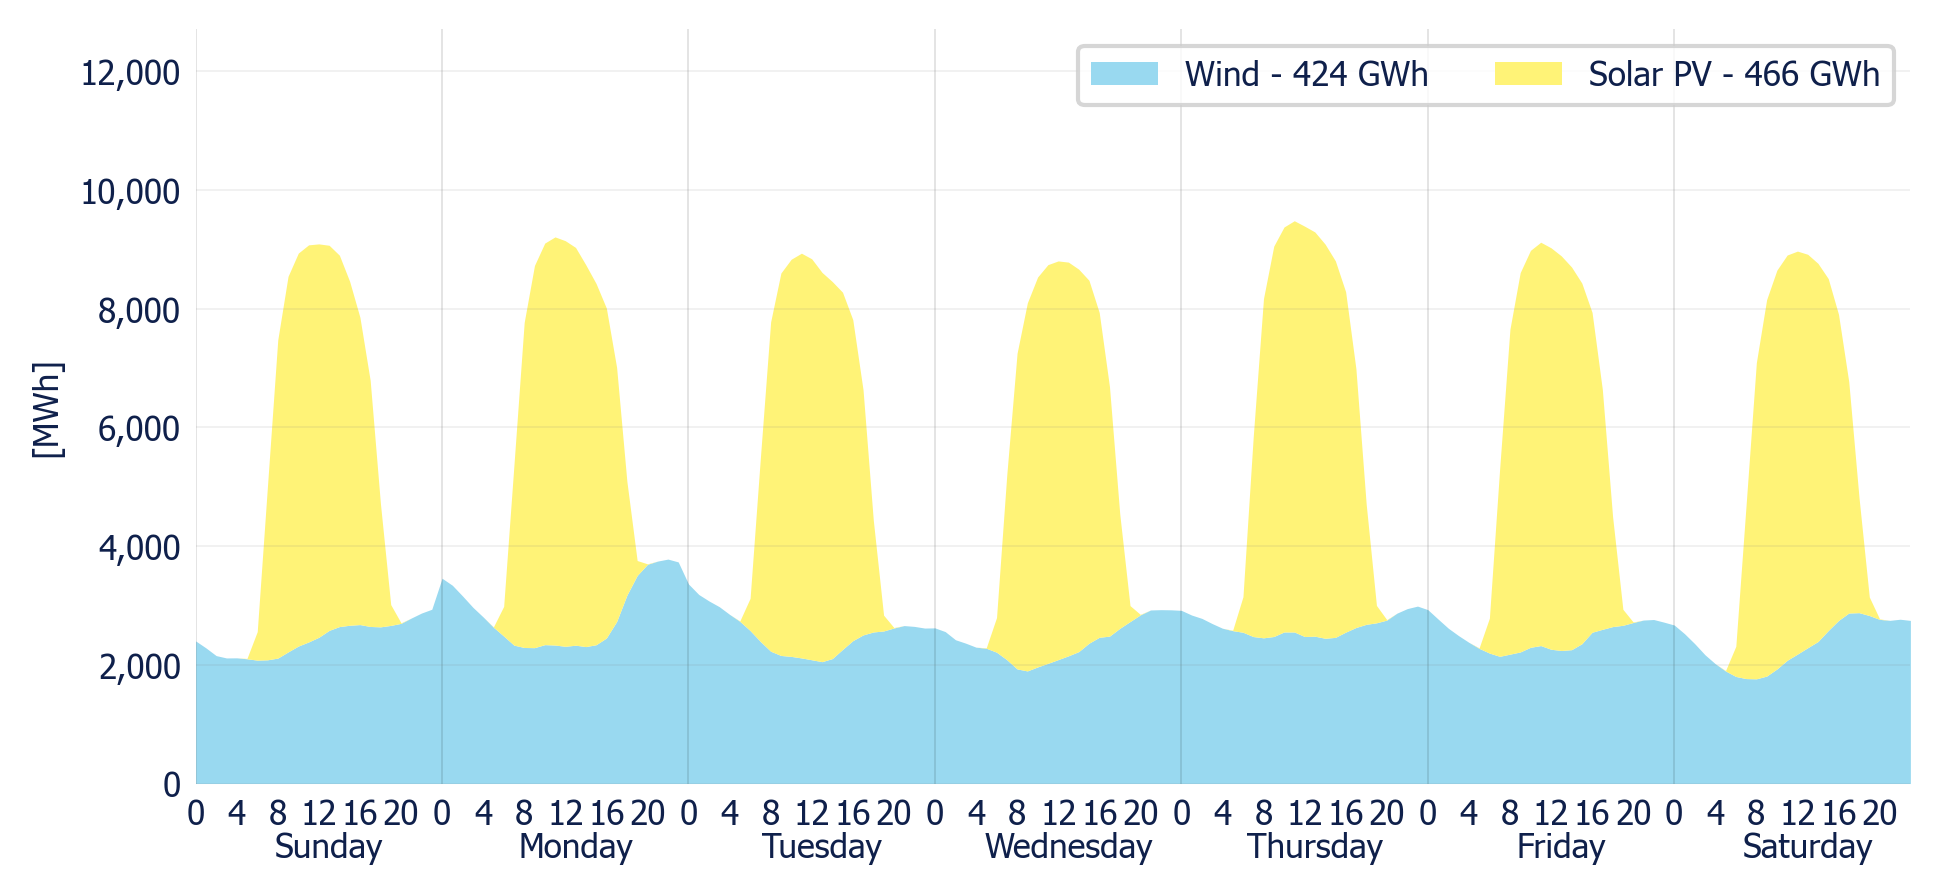
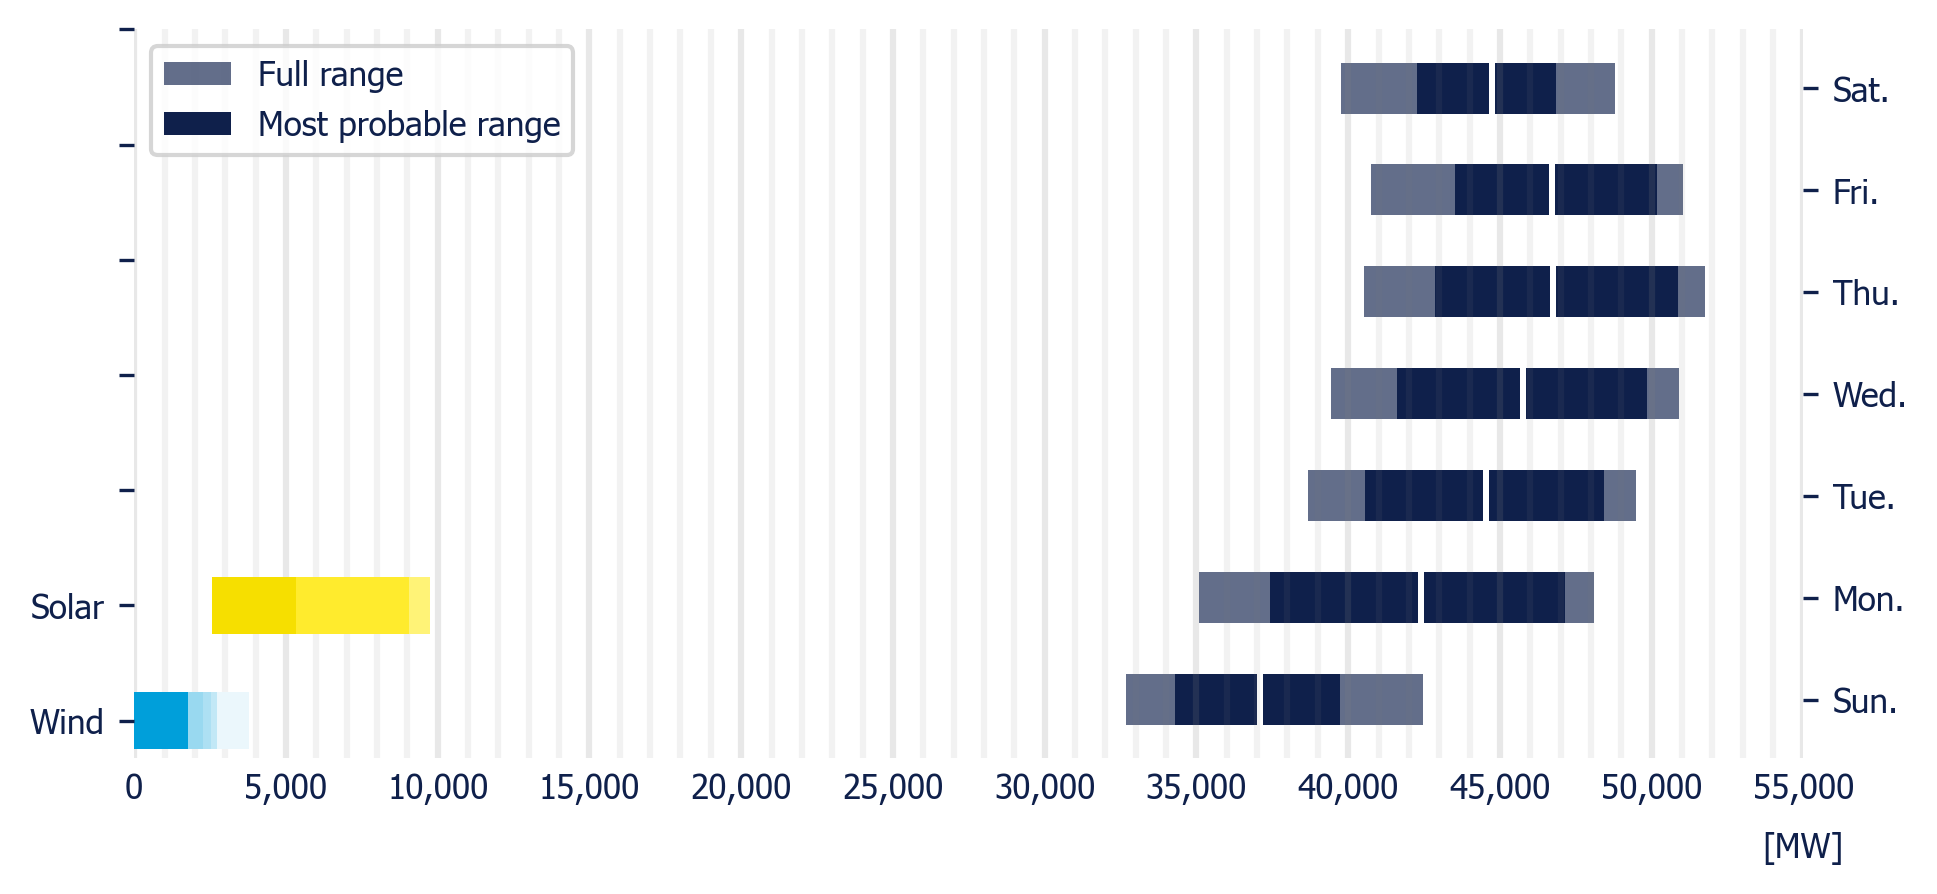
Wind generation forecast decreased compared to the previous week by 80.61 GWh (-23.5%). The same pattern was followed by solar generation forecast, with a decrease of 8.58 GWh, compared to last week (-1.9%).
|
|
Wind and Solar captured prices were USD 1.3/MWh and USD 5.8/MWh lower than the Energy Component, respectively.
|
|
Wind & Solar generation forecast for the SIN (MDA)
|
|
|
|
|
|
Solar PV Price*
|
Wind Price*
|
|
|
|
|
|
|
*Energy weighted average LMP, using LMP in Victoria
|
|
|
|
|
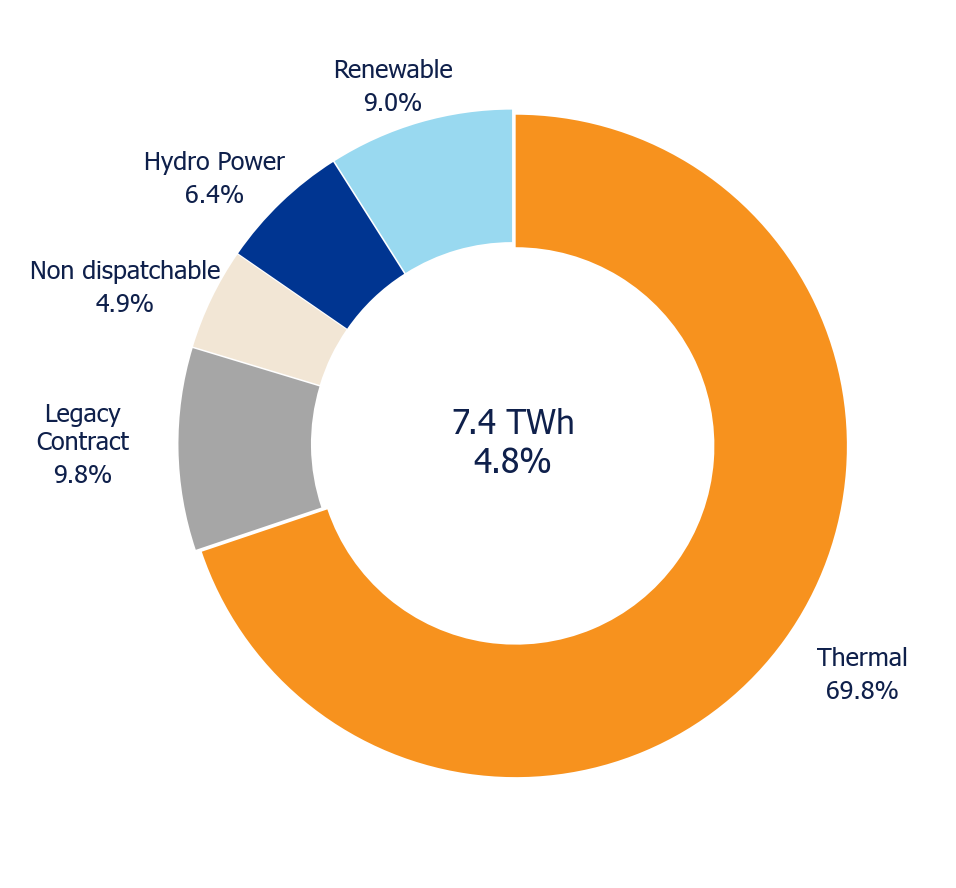
Weekly planned demand increased by 4.05% from the previous week to 7.7 TW, while peak demand was 49.8 GW showing an increase of 1.43% compared to the previous week.
|
|
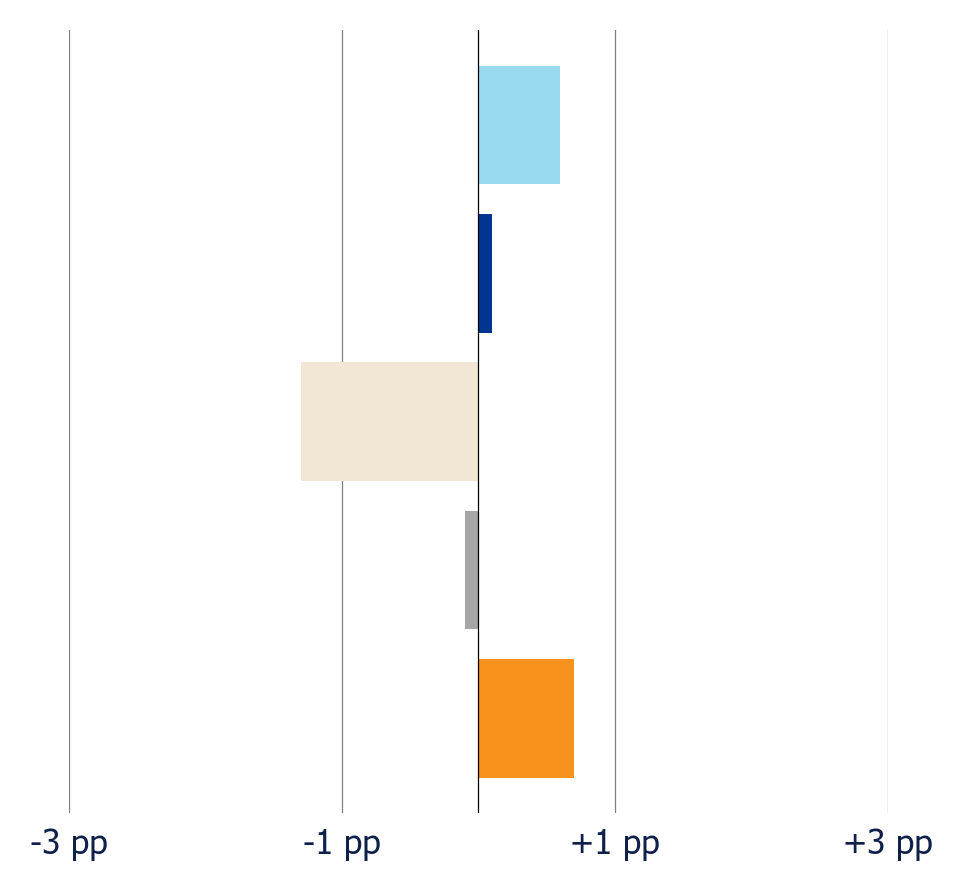
Shares of generation compared to the previous week were: Thermal +1.66 pp, Legacy Contract -0.97 pp, Non dispatchable +0.08 pp, Hydro Power +0.47 pp and Renewable -1.23 pp.
|
|
Planned generation mix
|
|
|
|
|
Planned variation
|
|
|
|
|
Planned demand in the MDA
|
|
|
|
|
|
|
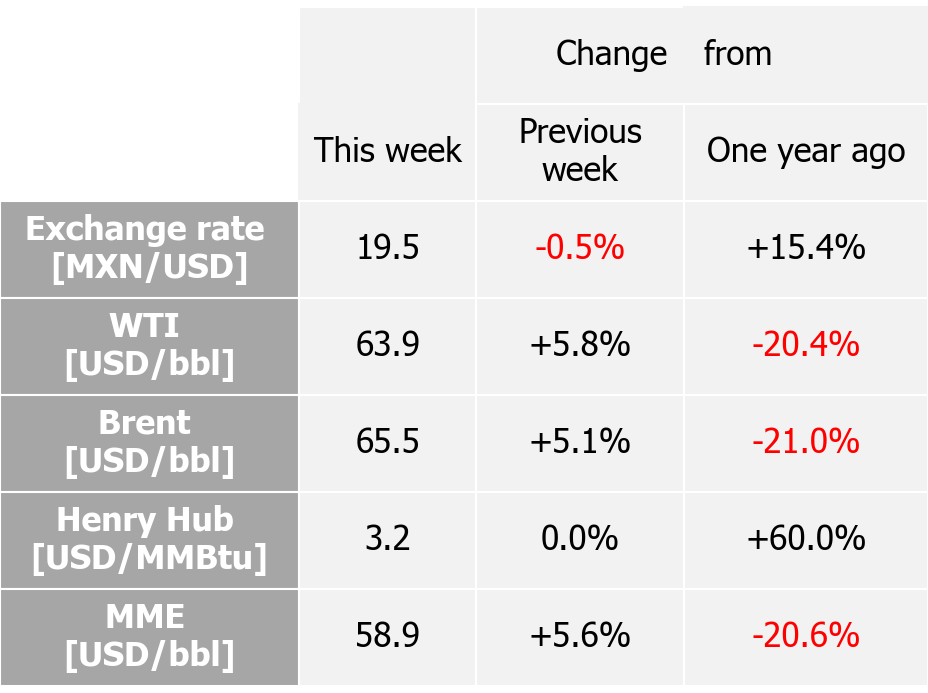
The MXN/USD exchange rate closed the week at 19.3 MXN/USD, decreasing marginally by 1.03%
|
|
Henry Hub natural gas benchmark closed the week at an average of USD 3.05/MMBtu, decreasing by 4.63%. Henry Hub natural gas prices showed a slight decline compared to the previous week, mainly influenced by moderate temperatures across the United States that reduced both heating and cooling demand. Additionally, high storage levels limited any significant upward pressure, while production remained stable. Market expectations regarding liquefied natural gas (LNG) exports also failed to generate a sustained price rebound. Overall, these factors reflected a balanced yet cautious market, with mixed signals from supply and demand shaping price behavior.
|
|
WTI, Brent, and MME crude oil benchmarks prices were -1.1%, +0.5%, and -0.8% from the previous week, respectively, closing at USD 63.26/bbl., USD 65.86/bbl., and USD 58.38/bbl. WTI prices declined due to lower global demand and a stronger U.S. dollar. Brent remained stable thanks to low inventory levels in Europe. The Mexican Export Blend (MME) rose slightly, driven by higher demand for heavy crude in the U.S. and a stable exchange rate. Overall, prices reflected a cautious market. Mixed signals from supply and demand shaped the weekly trend.
|
|
Map
|
|
|
|
|
International indexes
|
|
|
|
|
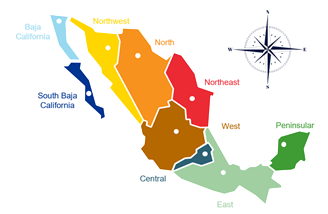
The nodes used for this report have been selected by DNV for their ability to represent the behavior of the different Control Regions within the SIN.
|
DNV, Insurgentes Sur 859, 03810 Ciudad de México, México
|
|
|
|
|
|
|