|
|
VOL 7 | NUM 41 | 21 April 2025
|
|
|
|
|
|
|
|
MEXICO - SIN | 6 - 12 April 2025
|
|
|
|
Power Markets Weekly
is a brief weekly review of the electric market operation in Chile, Mexico, Iberia, France and Italy. If you are not a subscriber, please feel free to subscribe
here
|
|
|
|
|
|
DNV offers tools for Wholesale Market analysis and operation:
- DNV Power Analytics (DNV-PA) is our web-based platform that provides access to constantly updated long-term energy price forecasts.
- With a refined design and an improved user experience we are upgrading our digital services for our customers.
|
|
|
|
|
|
|
Reduction in demand and fuel costs cause the PML to drop by 20%
|
|
|
|
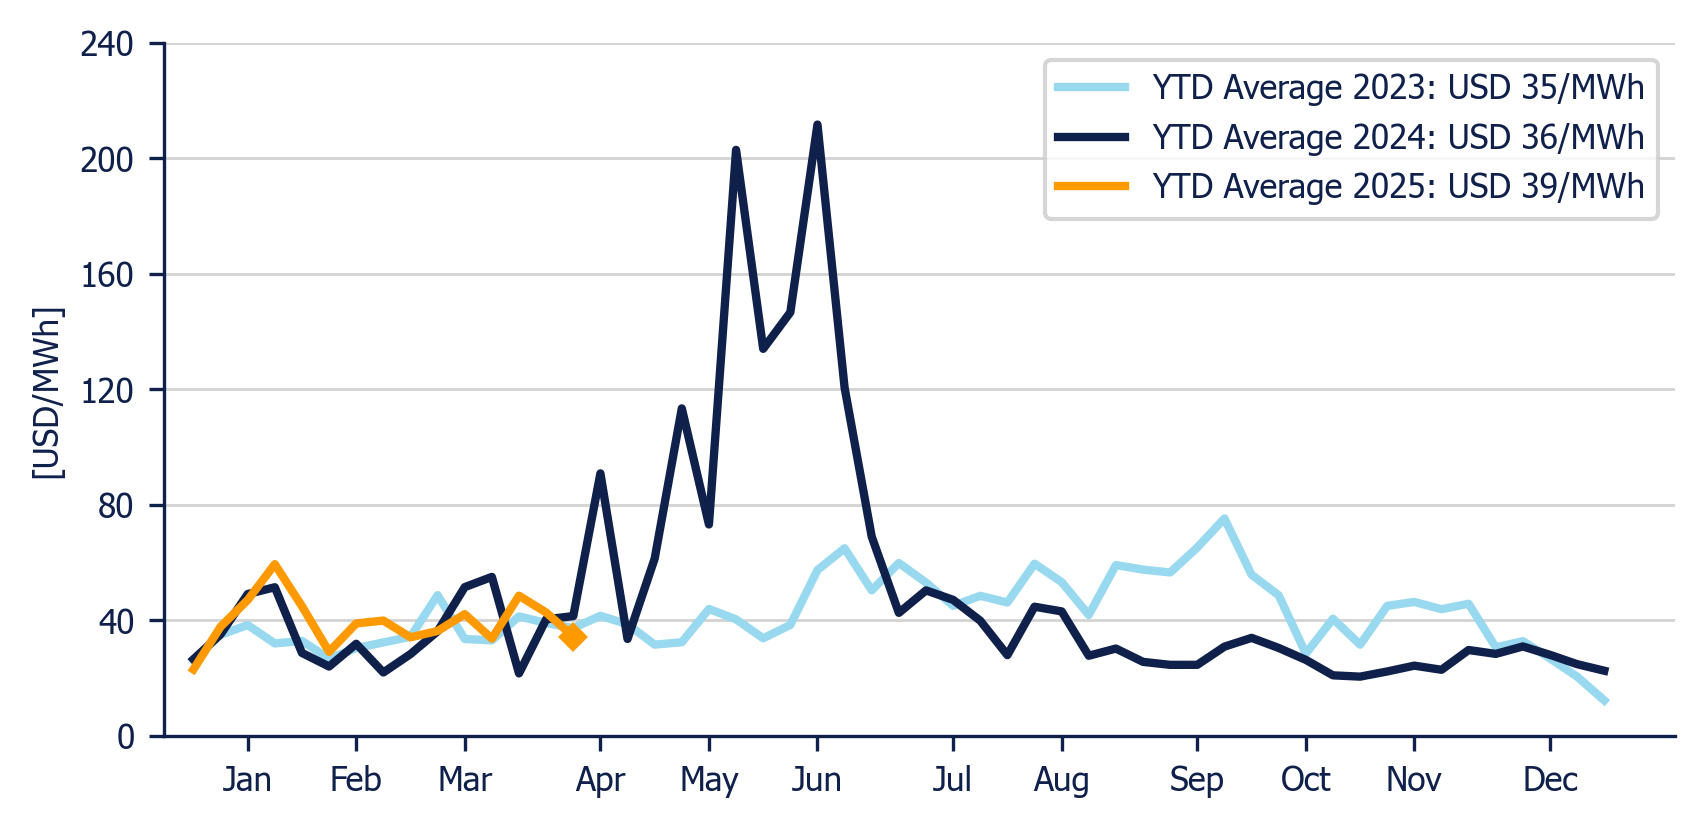
The Energy Component weekly average in the Day-Ahead Market (MDA) decreased to USD 34/MWh.
|
|
The Energy Component was 20% and 17.1% lower than the previous week and than the same week in 2024, respectively.
|
|
The highest Day-Ahead Market LMP (Local Marginal Price) was recorded in Candelaria Dos (Peninsular) at USD 511/MWh, while the lowest was recorded in Valle de Mexico Maniobras (Center) at USD -45.17/MWh.
|
|
Energy Component of the National Interconnected System - Weekly average
|
|
|
|
|
|
|
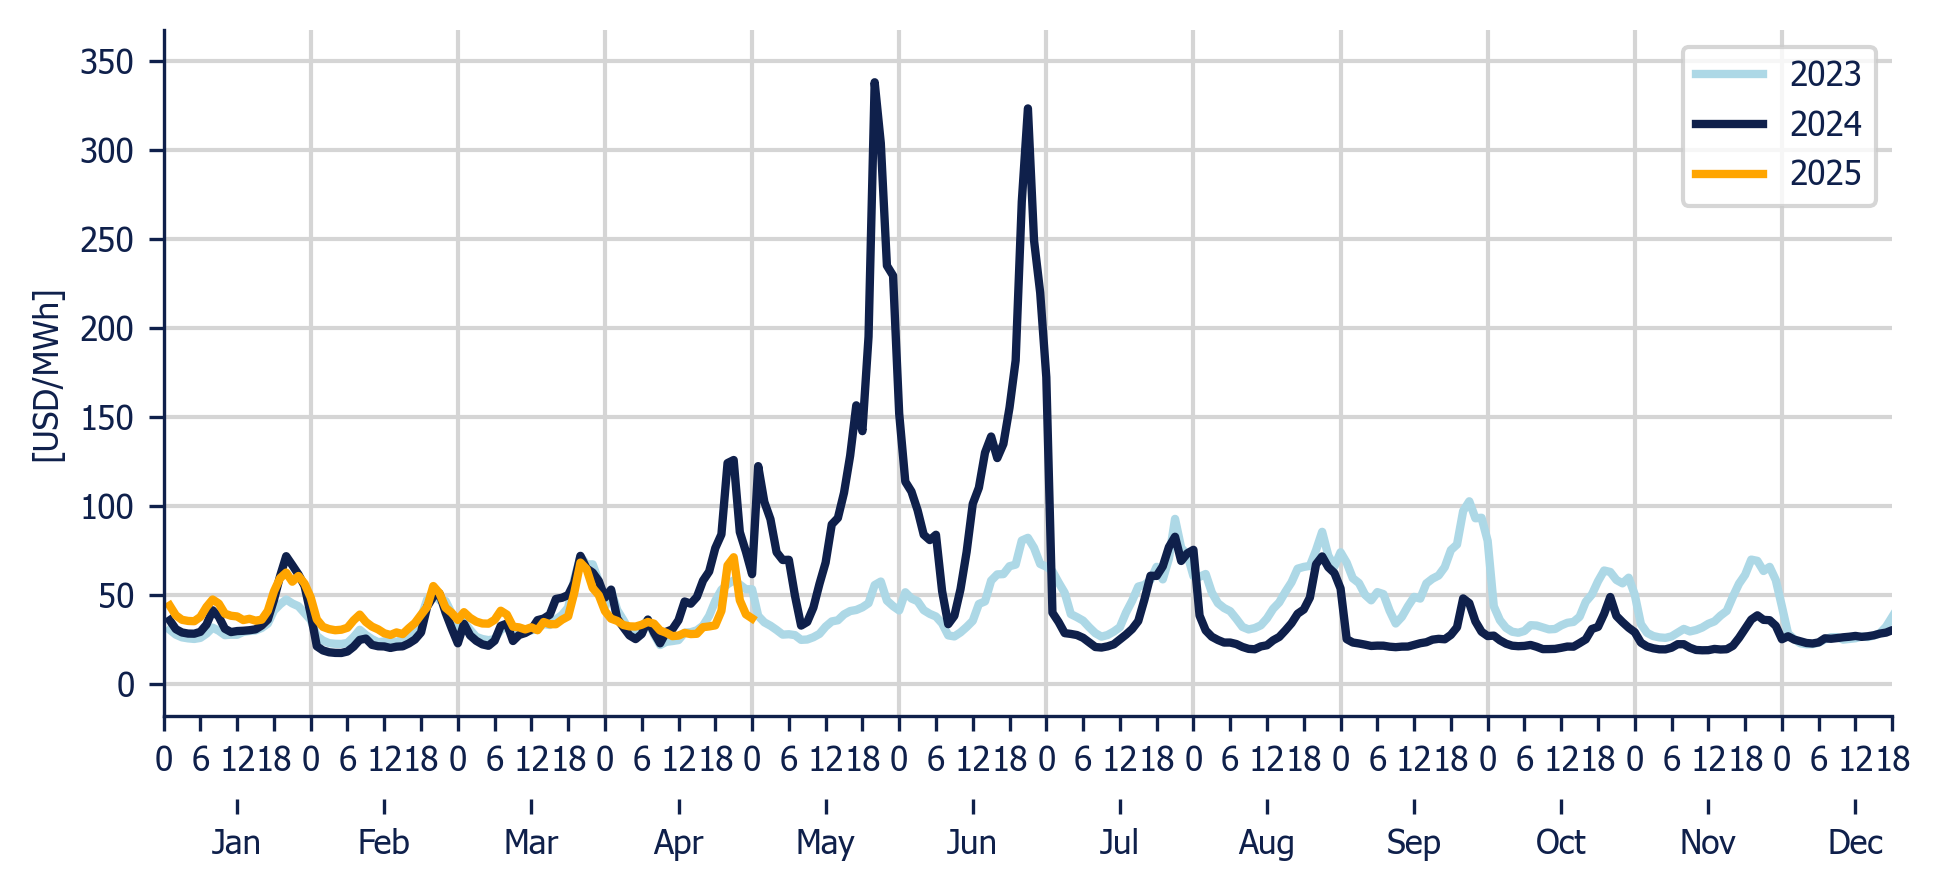
Energy Component of the National Interconnected System - Hourly average per month
|
|
|
|
|
|
|
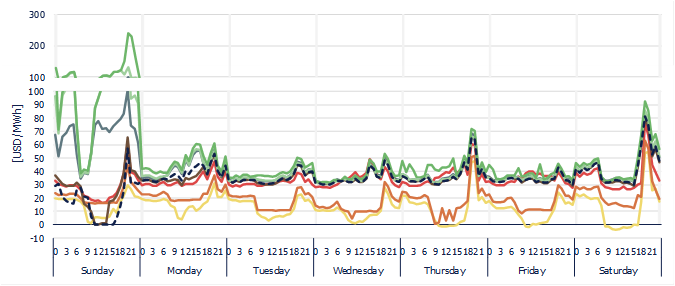
The Energy Component ranged between USD 0/MWh and USD 80.97/MWh. High congestion in the Peninsular region is reflected in both the East and Central regions, resulting in similar price trends throughout the week. Negative losses in the north zones of the country impact on the price trend similarity among the Northwest, North, and Northeast regions. Wind and solar generation increased while thermal generation decreased this week. The highest prices of the week occurred on Sunday during peak hours; besides of this day, prices remained steady across almost all regions throughout the week.
|
|
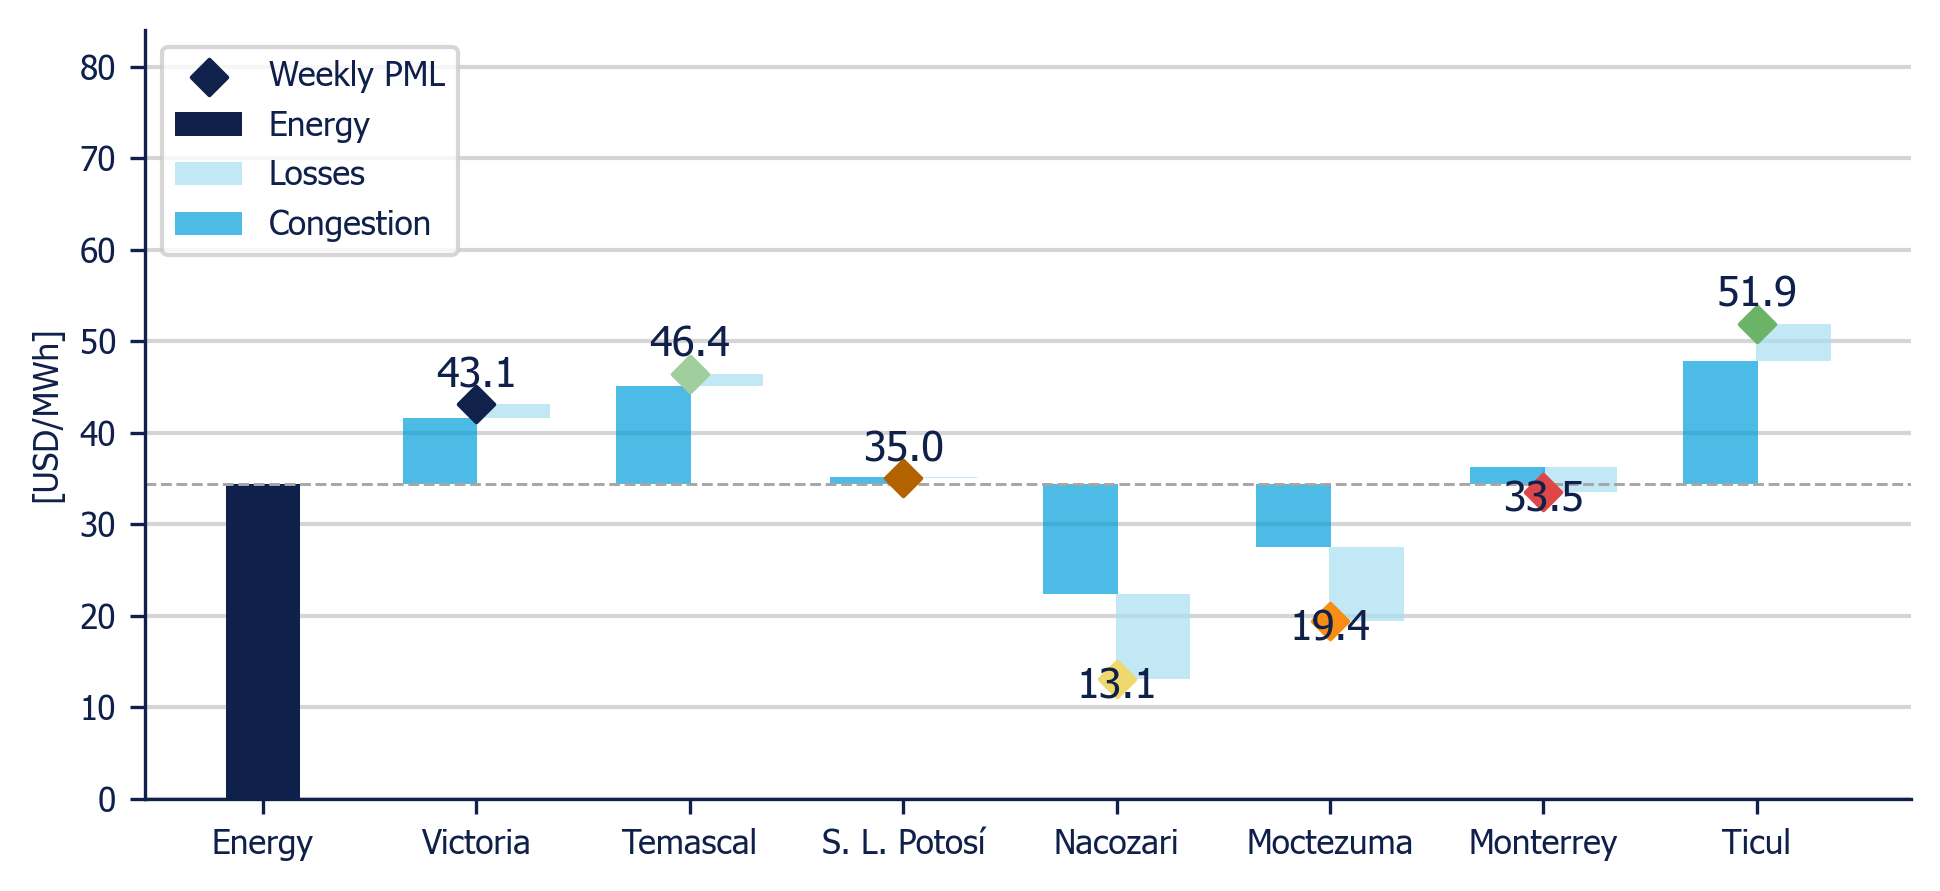
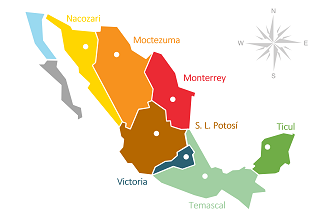
The trend of the PMLs in each reference node is represented below in percentage difference (%) from the weekly average of the Energy Component:
|
- Central (Victoria) +25.4%
- Northeast (Monterrey) -2.4%
- Northwest (Nacozari) -62.0%
- North (Moctezuma) -43.7%
- West (San Luis Potosi) +1.8%
- East (Temascal) +35.1%
- Peninsular (Ticul) +51.0%
|
|
Weekly evolution of Local Marginal Price (PML) in 7 reference nodes (MDA)
|
|
|
|
|
|
|
Victoria
USD 43.1/MWh
|
|
Monterrey
USD 33.5/MWh
|
|
Nacozari
USD 13.1/MWh
|
|
Moctezuma
USD 19.4/MWh
|
|
|
S. L. Potosí
USD 35.0/MWh
|
|
Temascal
USD 46.4/MWh
|
|
Ticul
USD 51.9/MWh
|
|
Energy Component
USD 34.4/MWh
|
|
|
|
|
|
Weekly Average PML Components in 7 reference nodes (MDA)
|
|
|
|
|
|
|
Hours
|
Transmission Link
|
Region
|
|
133
|
Tapachula - Los Brillantes
|
East
|
|
83
|
Culiacan - Mazatlan
|
Northwest
|
|
47
|
Chihuahua - Noreste + Camargo Dos - Gomez Palacio
|
North
|
|
42
|
Los Mochis - Guamuchil
|
Northwest
|
|
27
|
Ciudad Industrial (Mexico) - Laredo Americano (USA)
|
Northeast
|
|
25
|
Sonora Norte - Juarez
|
North
|
|
21
|
Teotihuacan - Texcoco
|
Central
|
|
|
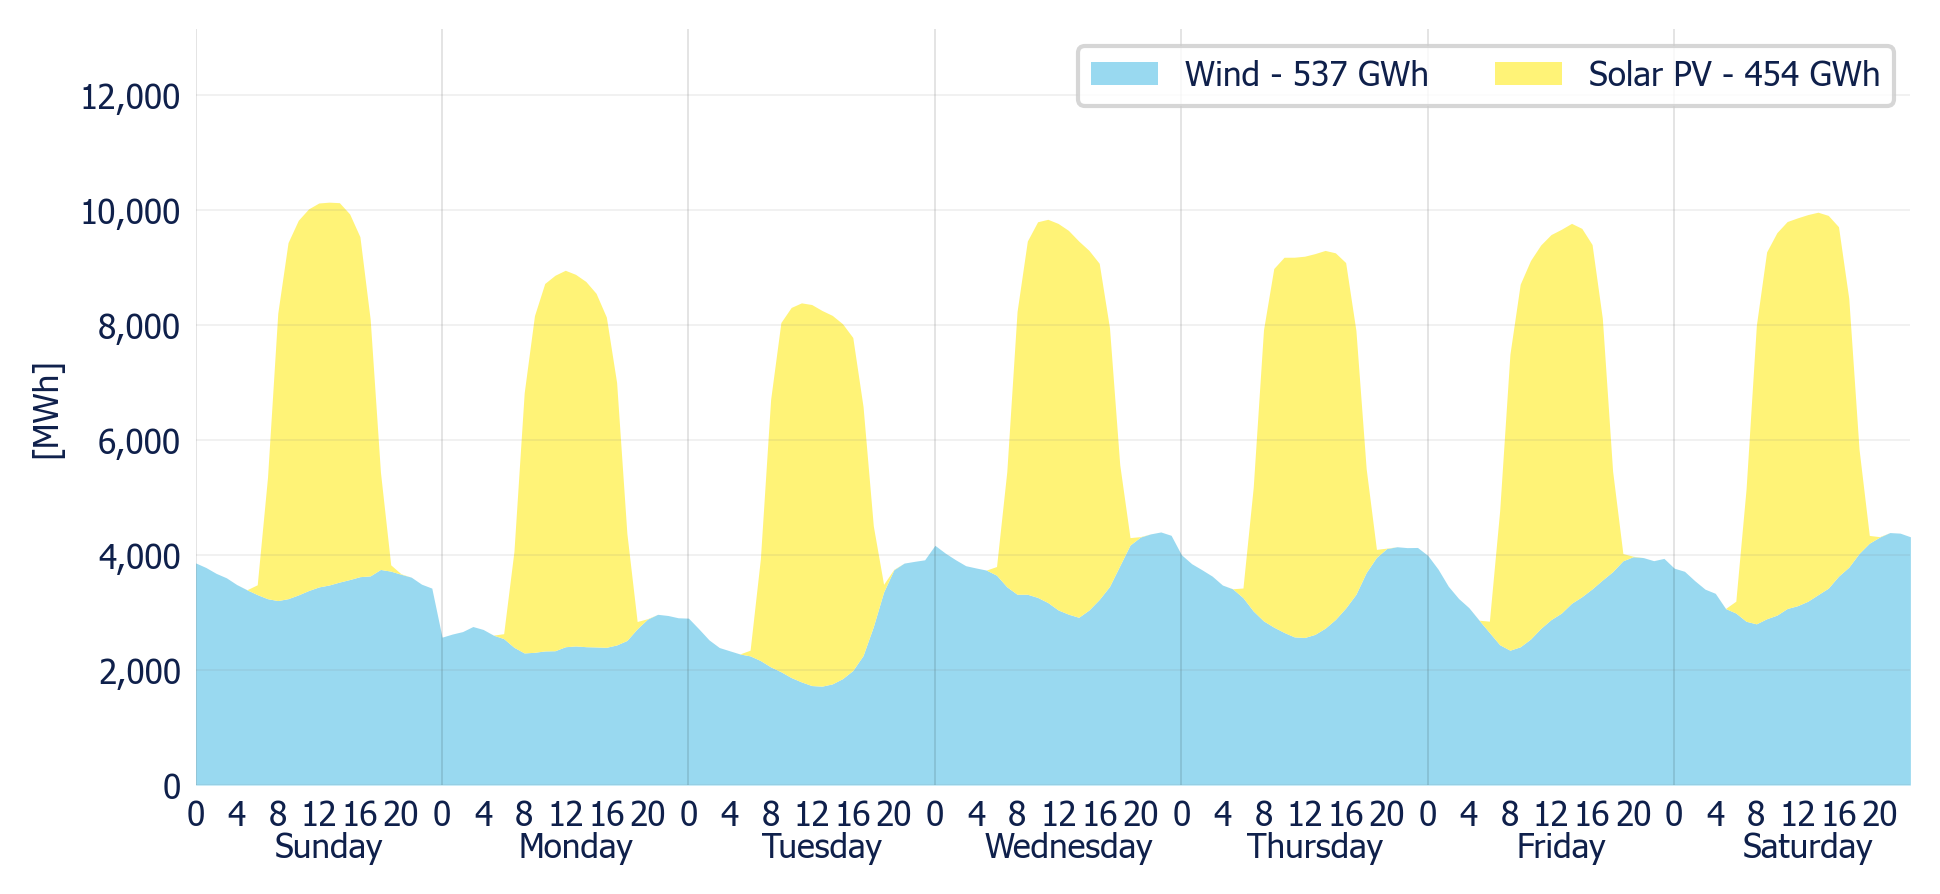
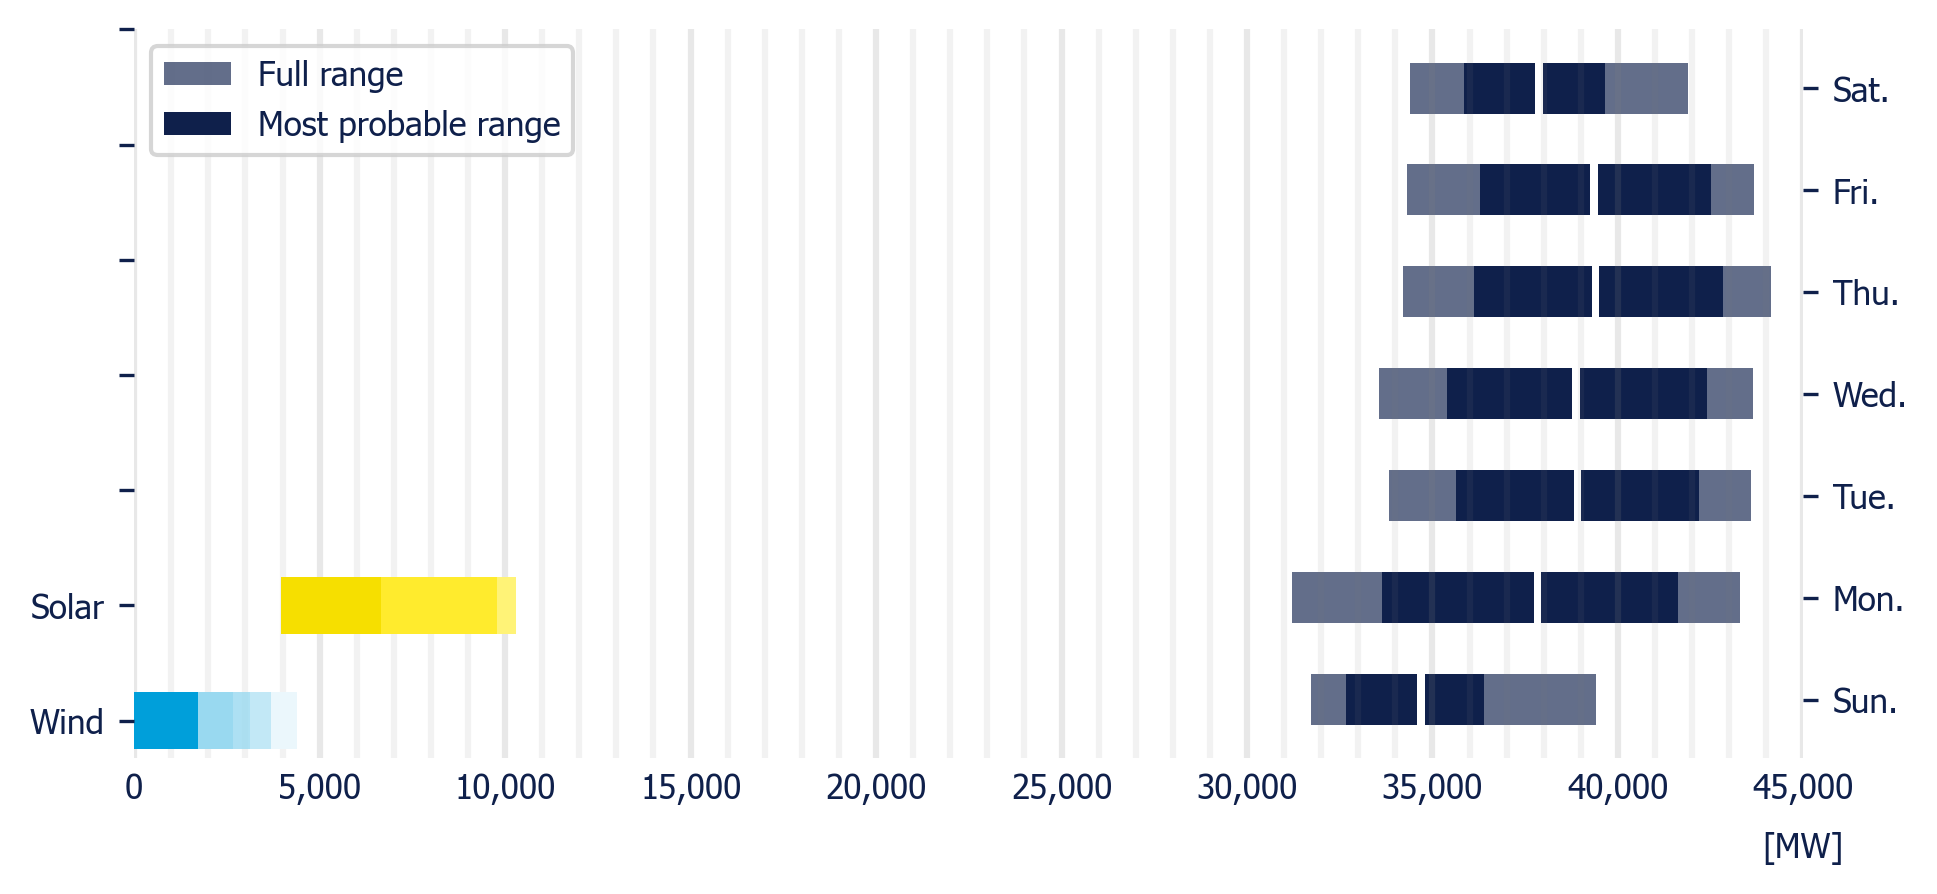
Wind generation forecast increased compared to the previous week by 113.49 GWh (+27.6%). The same pattern was followed by solar generation forecast, with an increase of 9.05 GWh, compared to last week (+2%).
|
|
Wind captured price was USD 0.6/MWh higher than the Energy Component, while solar captured price was USD 3.6/MWh lower than the Energy Component.
|
|
Wind & Solar generation forecast for the SIN (MDA)
|
|
|
|
|
|
Solar PV Price*
|
Wind Price*
|
|
|
|
|
|
|
*Energy weighted average LMP, using LMP in Victoria
|
|
|
|
|
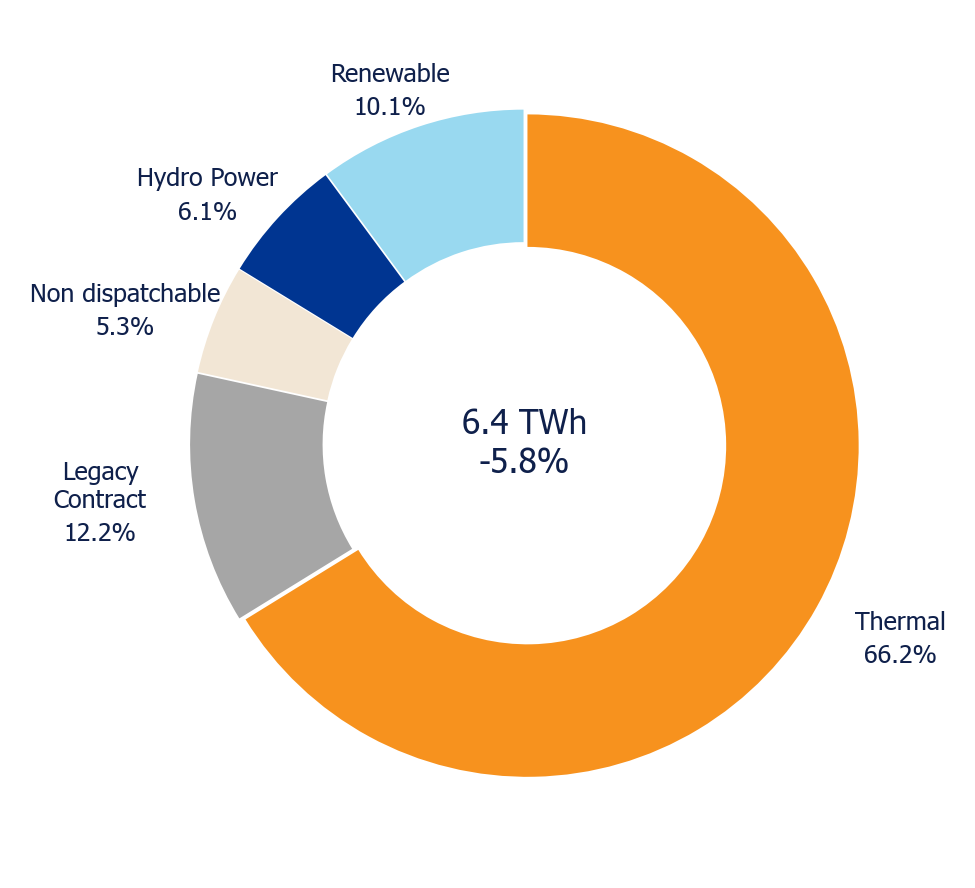
Weekly planned demand decreased by 5.88% from the previous week to 6.4 TW, while peak demand was 41.7 GW showing a decrease of 6.5% compared to the previous week.
|
|
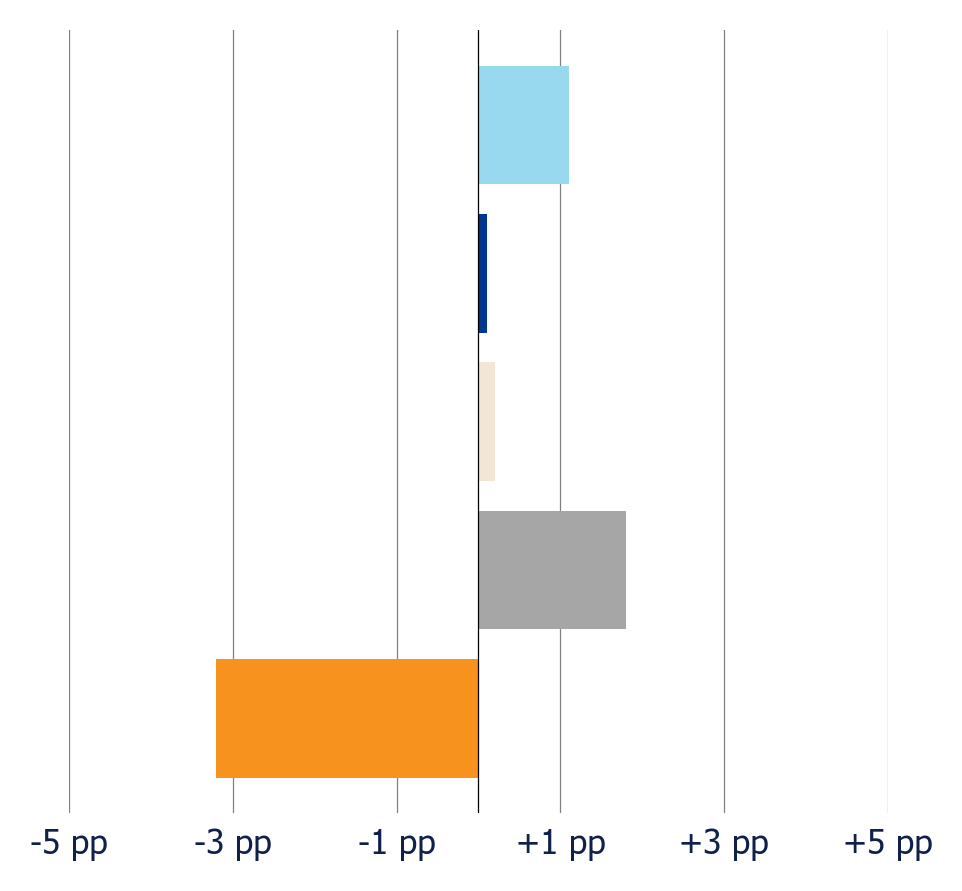
Shares of generation compared to the previous week were: Thermal -3.2 pp, Legacy Contract +1.81 pp, Non dispatchable +0.23 pp, Hydro Power +0.08 pp and Renewable +1.06 pp.
|
|
Planned generation mix
|
|
|
|
|
Planned variation
|
|
|
|
|
Planned demand in the MDA
|
|
|
|
|
|
|
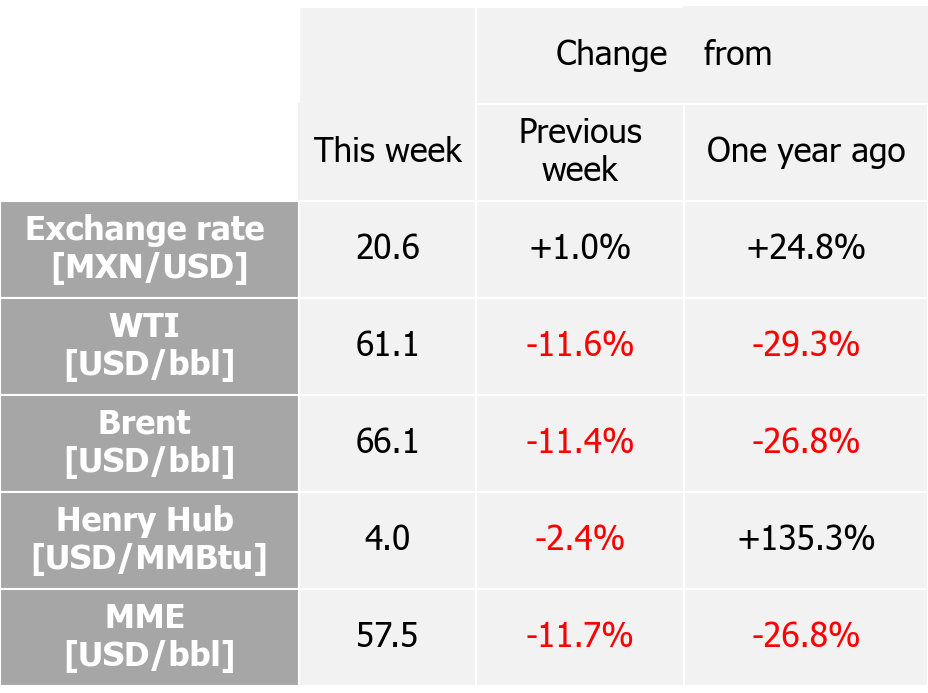
The MXN/USD exchange rate closed the week at 20.6 MXN/USD, increasing marginally by 0.98%
|
|
Henry Hub natural gas benchmark closed the week at an average of USD 3.77/MMBtu, decreasing by 7.48%. Between April 6 and 12, 2025, the price of natural gas at Henry Hub rose from $3.34 to $4.86 per MMBtu, and 7% lower than previous week. This rise is linked to a general uptick in gas prices, driven by cold weather conditions. In response to signs of higher demand, U.S. producers plan to increase production in 2025. This marks a shift from previous cuts in natural gas supply.
|
|
WTI, Brent, and MME crude oil benchmarks prices were -13.5%, -13.2%, and -13.4% from the previous week, respectively, closing at USD 60.85/bbl., USD 65.93/bbl., and USD 57.47/bbl. During the week, WTI and Brent oil prices dropped to their lowest levels since 2021, reaching $58.95 and $63.15 per barrel, respectively, though they slightly recovered by the end of the week. This decline was driven by geopolitical tensions and new U.S. tariffs. Exporting countries like Angola, Nigeria, and Venezuela faced financial pressure, including margin calls on debt. Mexico was also affected by reduced oil revenues, which could impact its federal budget.
|
|
Map
|
|
|
|
|
International indexes
|
|
|
|
|
The nodes used for this report have been selected by DNV for their ability to represent the behavior of the different Control Regions within the SIN.
|
DNV, Insurgentes Sur 859, 03810 Ciudad de México, México
|
|
|
|
|
|
|