|
|
VOL 7 | NUM 30 | 31 January 2025
|
|
|
|
|
|
|
|
MEXICO - SIN | 19 - 25 January 2025
|
|
|
|
Power Markets Weekly
is a brief weekly review of the electric market operation in Chile, Mexico, Iberia, France and Italy. If you are not a subscriber, please feel free to subscribe
here
|
|
|
|
|
|
DNV offers tools for Wholesale Market analysis and operation:
- DNV Power Analytics (DNV-PA) is our web-based platform that provides access to constantly updated long-term energy price forecasts.
- With a refined design and an improved user experience we are upgrading our digital services for our customers.
|
|
|
|
|
|
|
As fuel prices dropped, the surge in demand led to a significant spike in prices
|
|
|
|
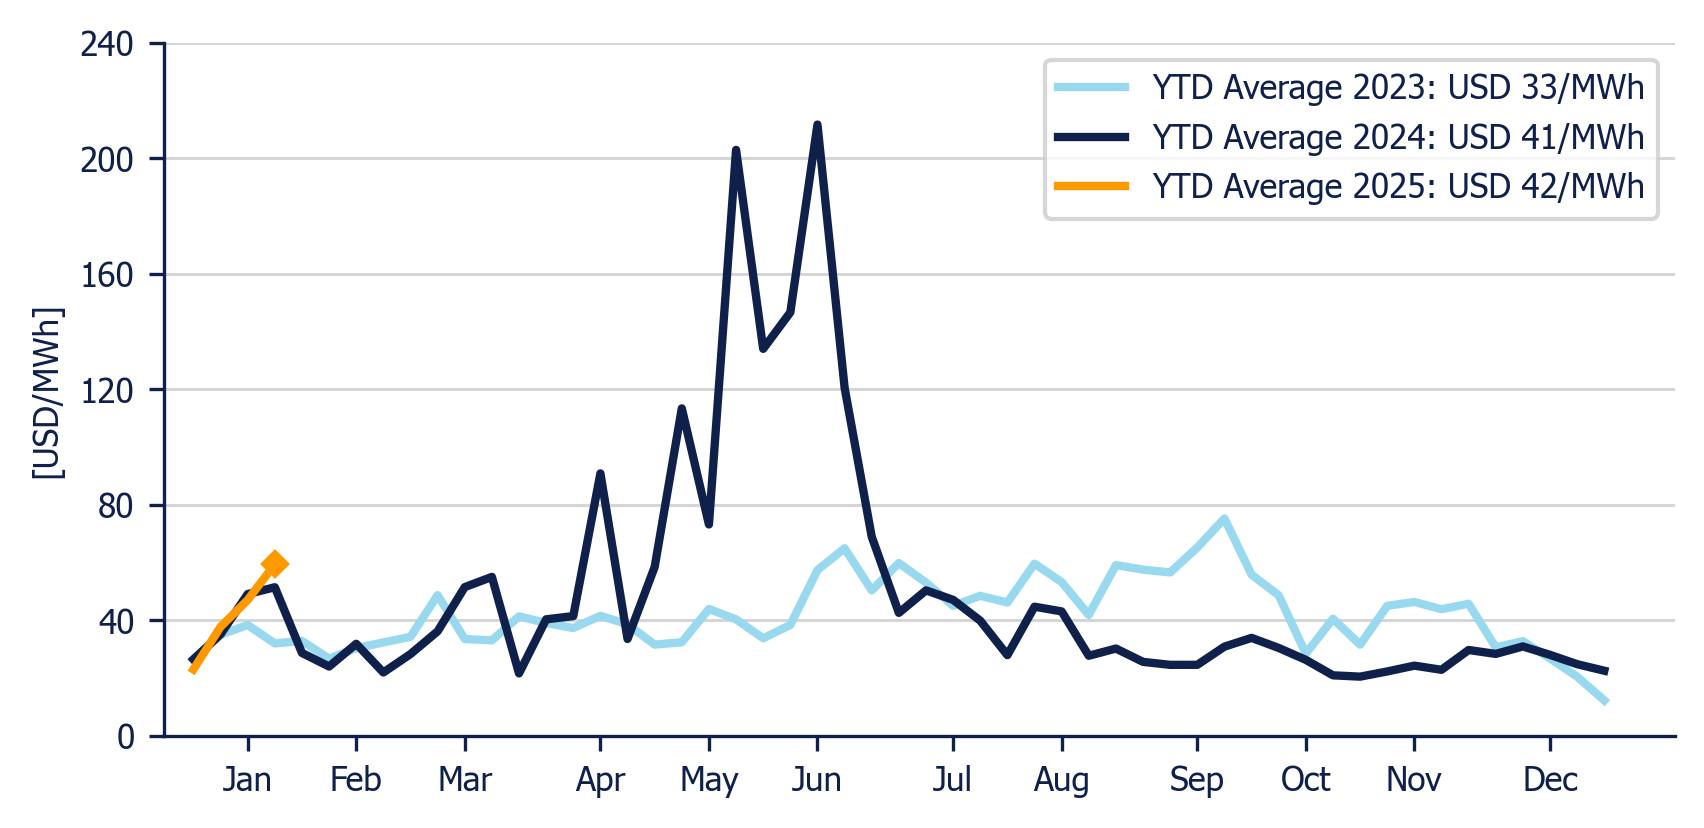
The Energy Component weekly average in the Day-Ahead Market (MDA) increased to USD 59/MWh.
|
|
The Energy Component was 26% and 107.1% higher than the previous week and than the same week in 2024, respectively.
|
|
The highest Day-Ahead Market LMP (Local Marginal Price) was recorded in Akumal Dos (Peninsular) at USD 591/MWh, while the lowest was recorded in Tizimin (Peninsular) at USD -8.38/MWh.
|
|
Energy Component of the National Interconnected System - Weekly average
|
|
|
|
|
|
|
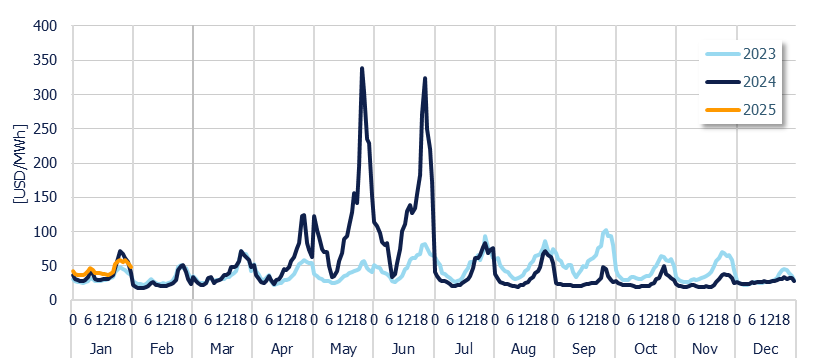
Energy Component of the National Interconnected System - Hourly average per month
|
|
|
|
|
|
|
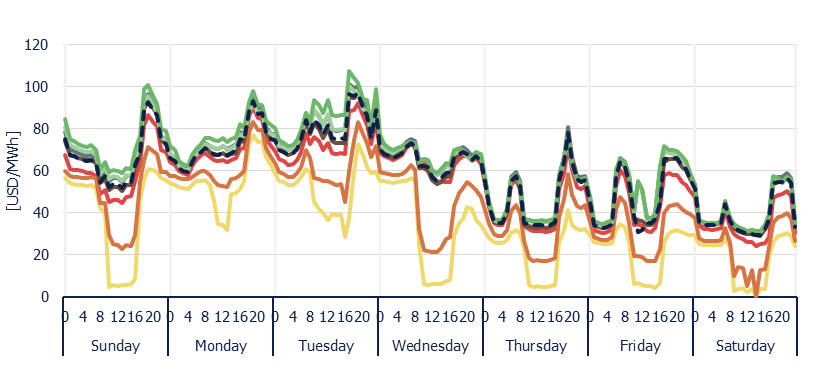
The Energy Component ranged between USD 29.51/MWh and USD 96.91/MWh. The recent increase in demand further pressured prices and increased volatility. At the beginning of the week, LMPs ranged from USD 4.6/MWh to 107.4/MWh. However, starting Wednesday, the decline variation in wind generation and i fuel prices led to a smaller difference in LMPs across the system.
|
|
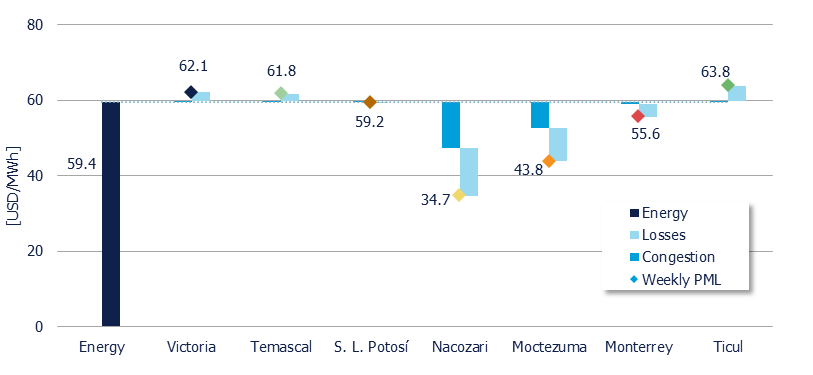
The trend of the PMLs in each reference node is represented below in percentage difference (%) from the weekly average of the Energy Component:
|
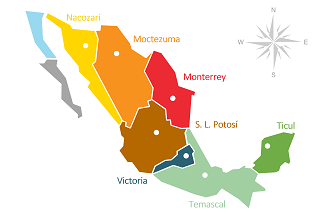
- Central (Victoria) +4.5%
- Northeast (Monterrey) -6.4%
- Northwest (Nacozari) -41.6%
- North (Moctezuma) -26.3%
- West (San Luis Potosi) -0.4%
- East (Temascal) +3.9%
- Peninsular (Ticul) +7.3%
|
|
Weekly evolution of Local Marginal Price (PML) in 7 reference nodes (MDA)
|
|
|
|
|
|
|
Victoria
USD 62.1/MWh
|
|
Monterrey
USD 55.6/MWh
|
|
Nacozari
USD 34.7/MWh
|
|
Moctezuma
USD 43.8/MWh
|
|
|
S. L. Potosí
USD 59.2/MWh
|
|
Temascal
USD 61.8/MWh
|
|
Ticul
USD 63.8/MWh
|
|
Energy Component
USD 59.5/MWh
|
|
|
|
|
|
Weekly Average PML Components in 7 reference nodes (MDA)
|
|
|
|
|
|
|
Hours
|
Transmission Link
|
Region
|
|
38
|
Ciudad Industrial (Mexico) - Laredo Americano (USA)
|
Northeast
|
|
30
|
Tapachula - Los Brillantes
|
East
|
|
21
|
Cumbres Frontera (Mexico) - Rail Road (USA)
|
Northeast
|
|
14
|
Culiacan- Mazatlan
|
Northwest
|
|
|
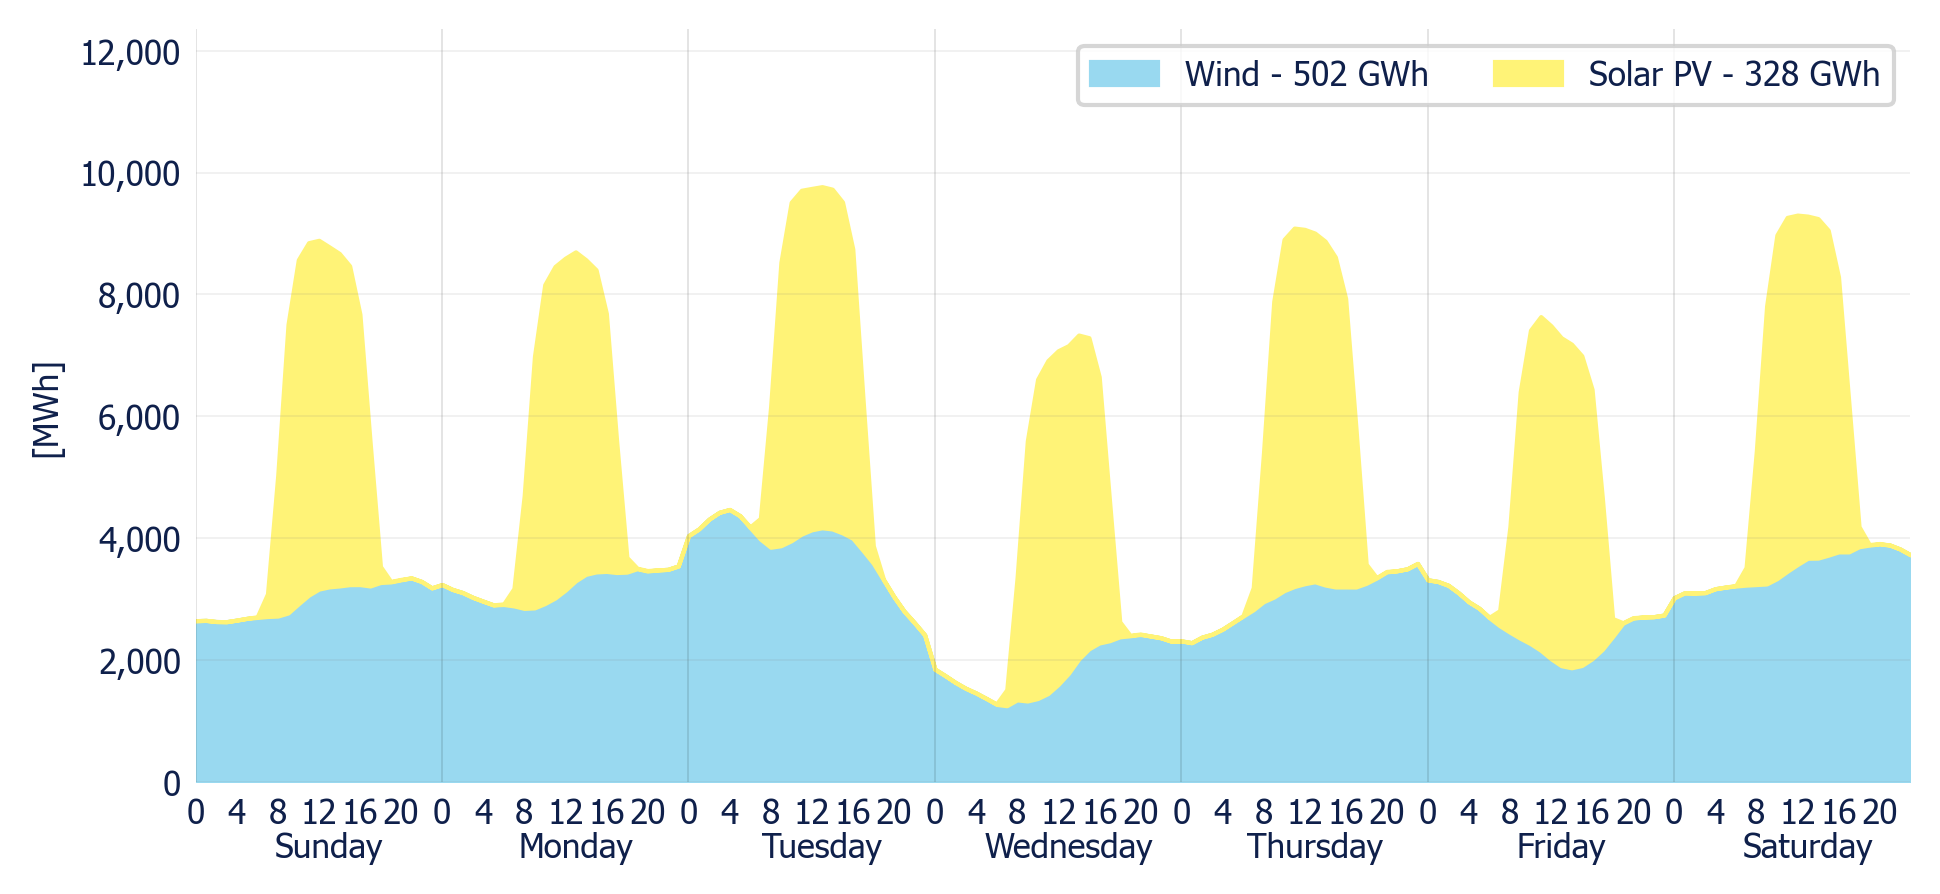
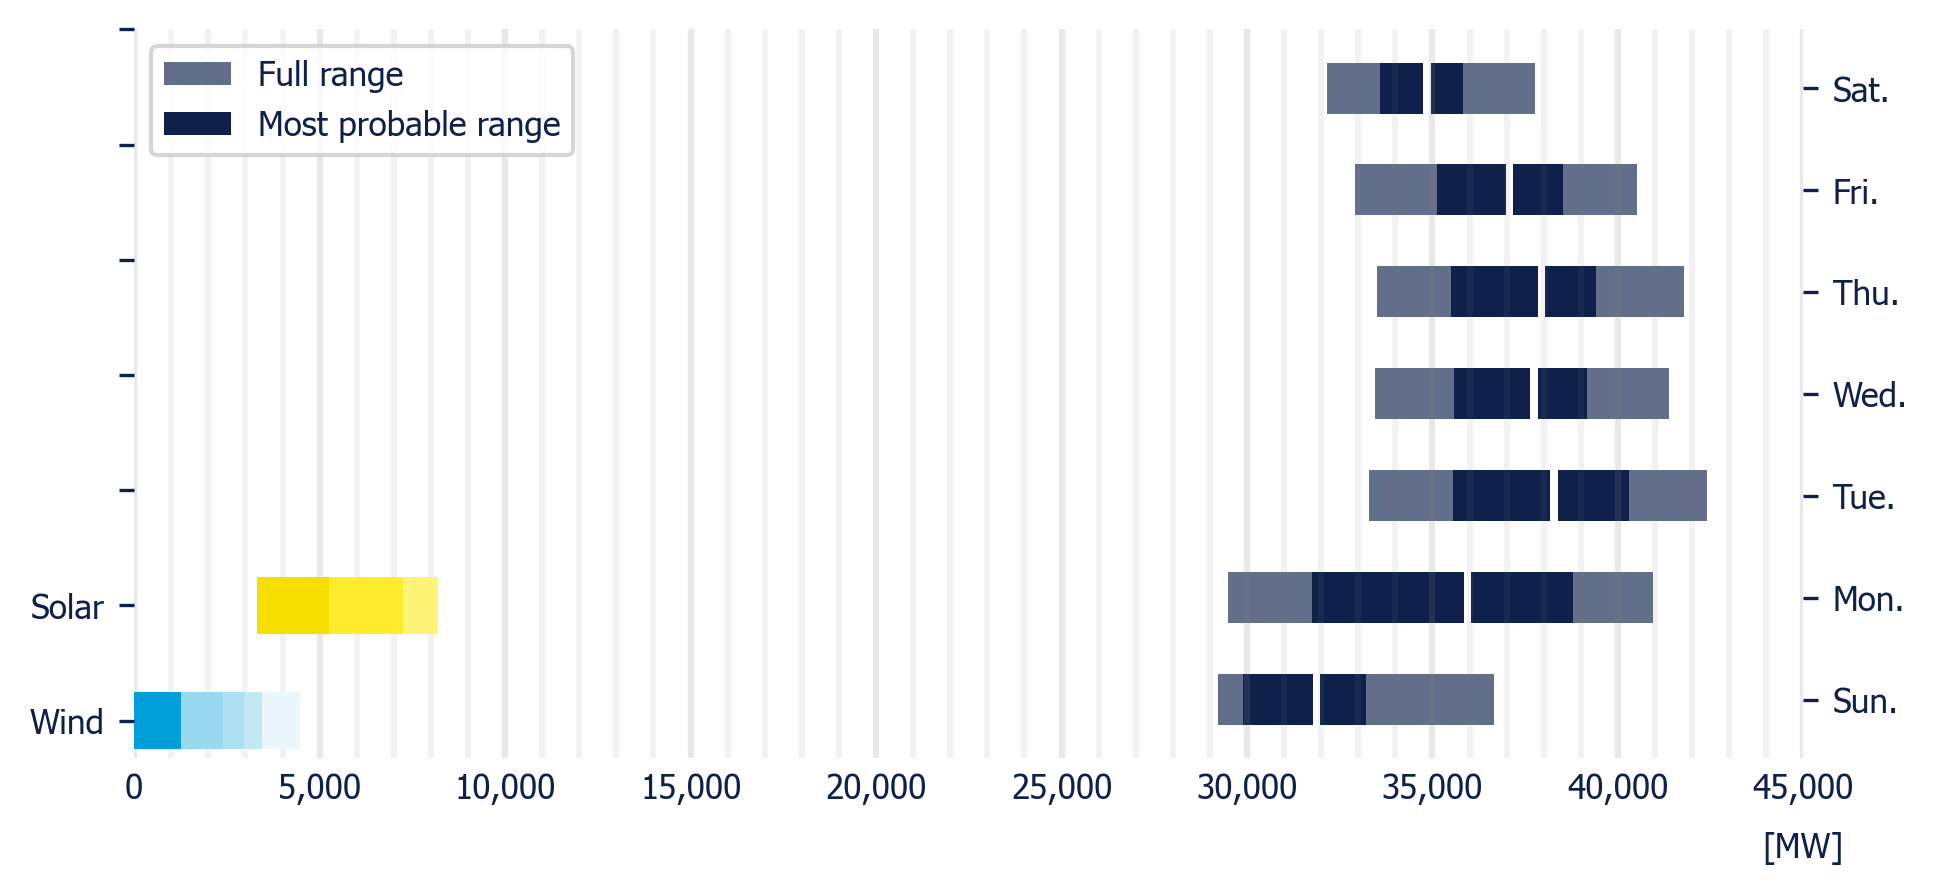
Wind generation forecast increased compared to the previous week by 52.97 GWh (+11.9%). The same pattern was followed by solar generation forecast, with an increase of 31.3 GWh, compared to last week (+10.6%).
|
|
Wind captured price was USD 0.4/MWh higher than the Energy Component, while solar captured price was USD 6.3/MWh lower than the Energy Component.
|
|
Wind & Solar generation forecast for the SIN (MDA)
|
|
|
|
|
|
Solar PV Price*
|
Wind Price*
|
|
|
|
|
|
|
*Energy weighted average LMP, using LMP in Victoria
|
|
|
|
|
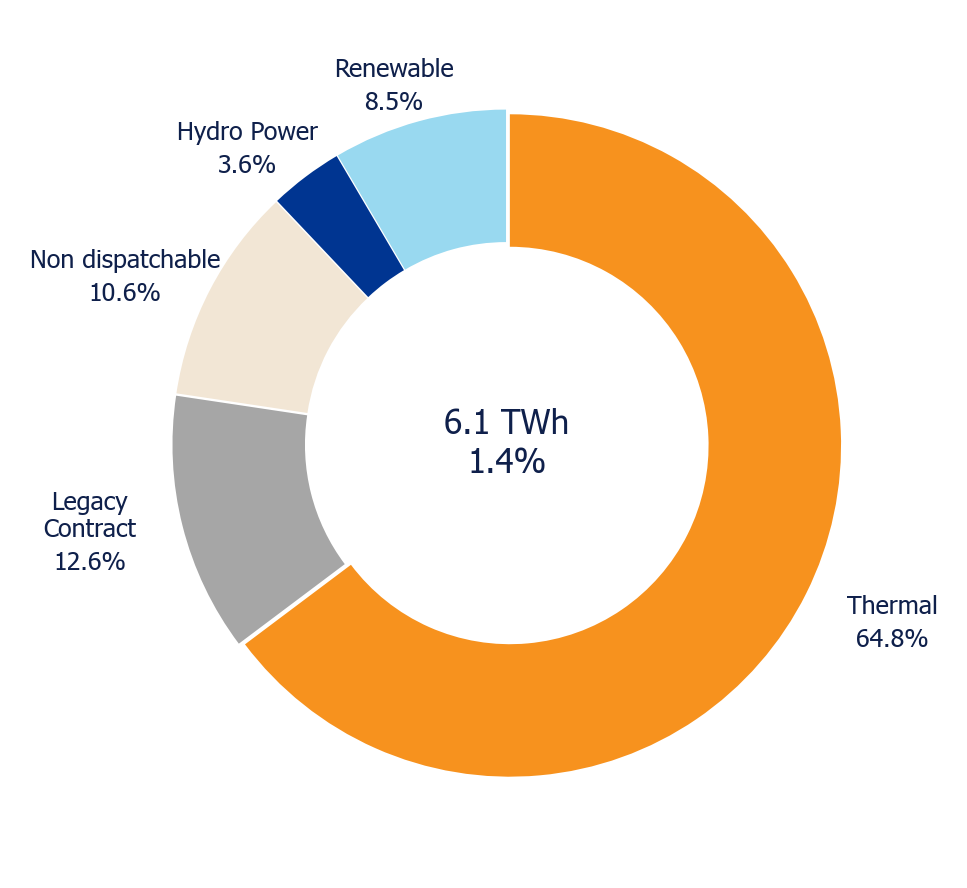
Weekly planned demand increased by 1.67% from the previous week to 6.1 TW, while peak demand was 40.2 GW showing an increase of 2.29% compared to the previous week.
|
|
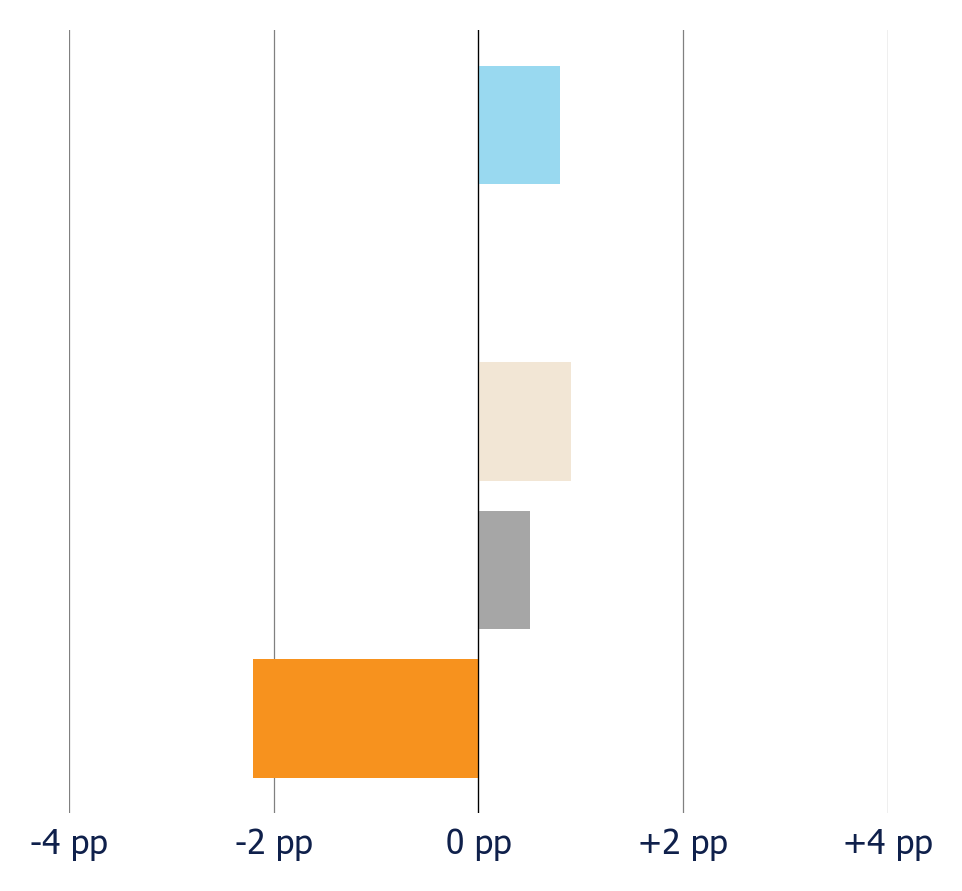
Shares of generation compared to the previous week were: Thermal -2.19 pp, Legacy Contract +0.54 pp, Non dispatchable +0.89 pp, Hydro Power -0.01 pp and Renewable +0.77 pp.
|
|
Planned generation mix
|
|
|
|
|
Planned variation
|
|
|
|
|
Planned demand in the MDA
|
|
|
|
|
|
|
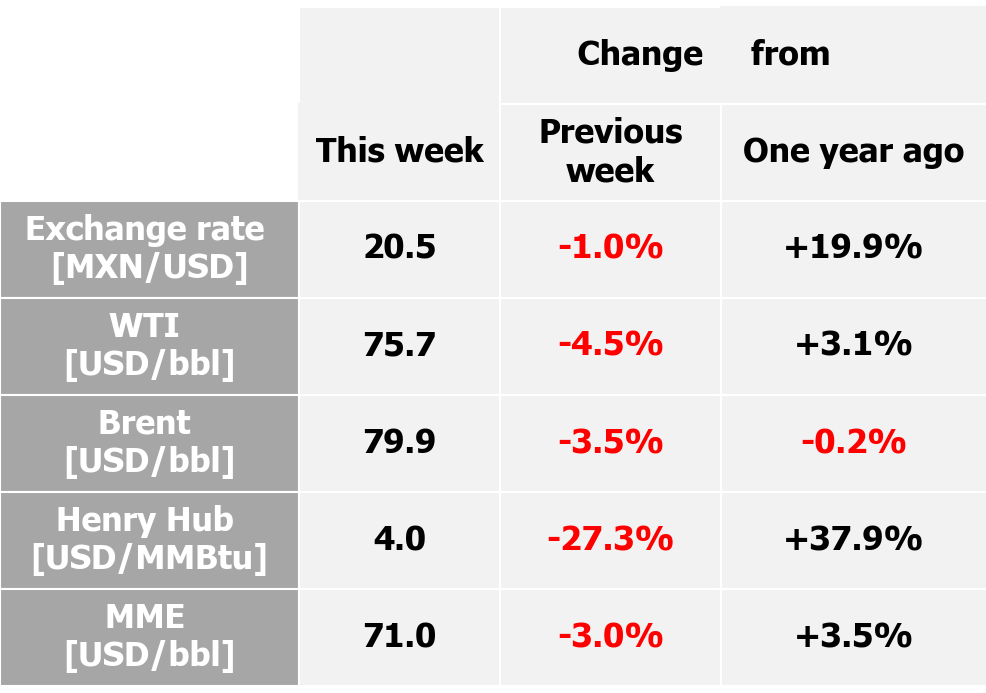
The MXN/USD exchange rate closed the week at 20.5 MXN/USD, decreasing marginally by 0.97%
|
|
Henry Hub natural gas benchmark closed the week at an average of USD 4.02/MMBtu, decreasing by 26.55%. Cash prices dropped sharply on Tuesday following a surge in anticipation of the three-day Martin Luther King Jr. holiday weekend. In other news, market analysts have raised forecasts, with Morgan Stanley projecting $4.15/MMBtu for 2025 due to export demand and tighter inventories, while the EIA predicts $3.10/MMBtu for 2025, rising to $4.00/MMBtu by 2026 due to supply-demand imbalances, following Donald Trump's inauguration as President of the United States.
|
|
WTI, Brent, and MME crude oil benchmarks prices were -4.7%, -3.6%, and -3.1% from the previous week, respectively, closing at USD 75.73/bbl., USD 79.92/bbl., and USD 71.04/bbl. According to experts of the industry, the price declines can be attributed to the significant uncertainty surrounding the new policies of the incoming president.
|
|
Map
|
|
|
|
|
International indexes
|
|
|
|
|
The nodes used for this report have been selected by DNV for their ability to represent the behavior of the different Control Regions within the SIN.
|
DNV, Insurgentes Sur 859, 03810 Ciudad de México, México
|
|
|
|
|
|
|