|
|
VOL 8 | NUM 5 | 7 October 2025
|
|
|
|
|
|
|
|
IBERIA | 29 September - 5 October 2025
|
|
|
|
Power Markets Weekly
is a brief weekly review of the electric market operation in Chile, Mexico, Iberia, France and Italy. If you are not a subscriber, please feel free to subscribe
here
|
|
|
|
|
|
DNV offers tools for Wholesale Market analysis and operation:
- DNV Power Analytics (DNV-PA) is our web-based platform that provides access to constantly updated long-term energy price forecasts.
- With a refined design and an improved user experience we are upgrading our digital services for our customers.
|
|
|
|
|
|
|
First week of quarter hourly operation of Day-Ahead Market closed with an average price very similar to last year
|
|
|
|
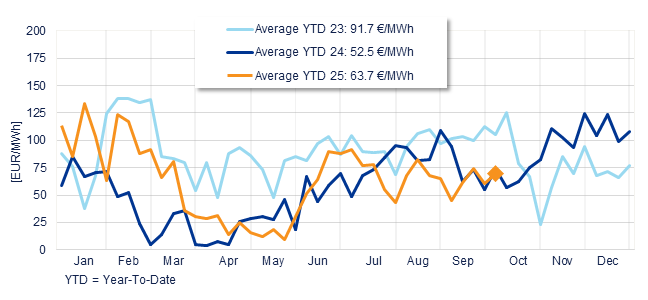
The average price of Day-Ahead Market in Spain reached EUR 69.4/MWh last week, registering a rise of 8.9% compared to the previous week's average (EUR 63.7/MWh). This weekly price was 6% lower than 2024 (EUR 74.1/MWh) and 34% lower than in 2023 (EUR 105.2/MWh).
|
|
YTD average is EUR 63.7/MWh, 21% higher than YTD value in 2024 (EUR 52.5/MWh) and -31% lower than YTD value in 2023 (EUR 91.7/MWh).
|
|
Annual evolution of the average weekly price of the Spanish Daily Market
|
|
|
|
|
|
|
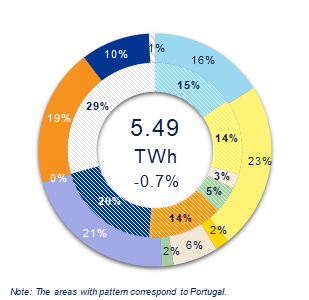
Generation plus imports in Iberia decreased by -0.7%, reaching 5.49 TWh, compared to the 5.53 TWh recorded the previous week.
|
|
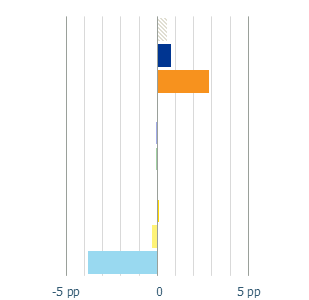
The main changes observed in the energy mix, compared to the previous week, were:
|
- Decrease in wind generation by 3.8 pp
- Resulting in rise of, gas and hydro generation by 2.8 pp, and 0.7 pp respectively
|
|
Global renewable energy share decreased from 57.8% to 54.5% since the previous week.
|
|
Generation Mix Iberia
|
|
|
|
|
Variation Iberia
|
|
|
|
|
|
Nuclear
|
|
Cogeneration
|
|
Renewable thermal
|
|
Coal
|
|
Combined cycle
|
|
|
Hydraulic
|
|
Wind
|
|
Solar PV
|
|
Solar thermal
|
|
Imports
|
|
|
|
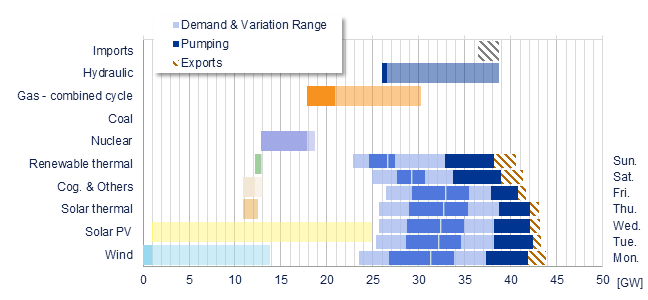
Power range by energy sources vs demand Iberia
|
|
|
|
|
|
|
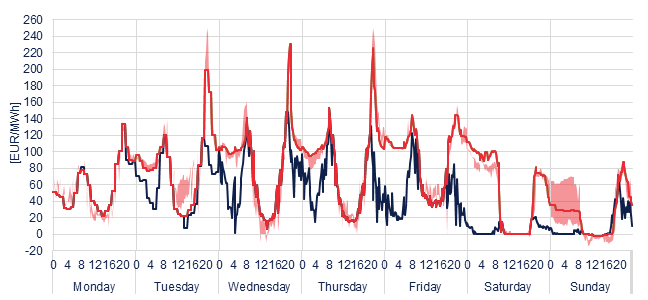
First week of quarter hourly operation for Spanish DAM! Prices presented a very classic behaviour with a volatile profile through the week, similar to the weeks before. The weekly maximum was EUR 230/MWh, reached on Wednesday from 9:30 p.m. to 10:00 p.m.. Minimum price, EUR -2.64/MWh was reached on Sunday at 2:00 p.m., coupled from France to Portugal.
|
|
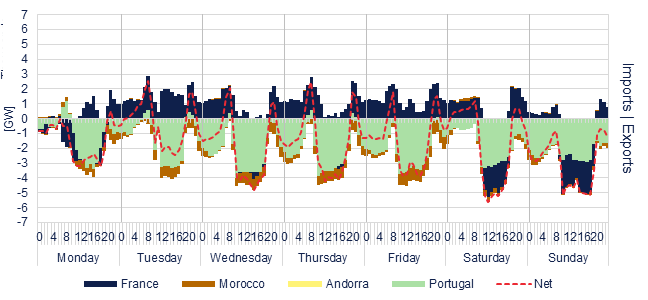
It is worth noticing that after a start of the week highly coupled in the SWE grid, every night showed high decoupling between France and Iberian peninsula, while every day was coupled, for the low price periods.
|
|
The SWE grid coupling was 44%, lower compared to the value recorded the previous week, 37%.
|
- Spain-Portugal: 100%
- Spain-France: 44%
- SWE (ES-PT-FR): 44%
|
|
Note: due to lack of quarter-hourly data for Portugal, it has been considered as 100% coupled with Spain.
|
|
Weekly evolution of the hourly price of the Day-ahead and Intraday Market (DAM and IM)
|
|
|
|
|
|
|
Spanish DAM
EUR 69.4/MWh
|
|
Spanish IM
EUR 69.2/MWh
|
|
Portugal DAM
EUR 69.4/MWh
|
|
France DAM
EUR 42.9/MWh
|
|
|
|
|
|
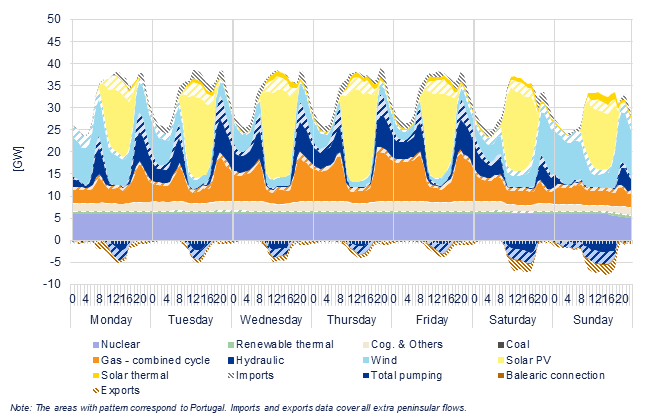
Hourly detail of the generation & interconnections in Iberia
|
|
The highlights from last week
|
- The hourly average output of nuclear generation was 5.9 GW, as Cofrentes was in planned maintenance (until October 26), and Almaraz 2 started to reduce load on Sunday, as it is starting its planned maintenance on October 6, planned until November 8th
- Hydraulic generation provided night-time peak generation. The hourly average production was 3.9 GW. Large pumping during day-time was present alongside the week in Spain and Portugal, specially over the weekend
- Gas generation provided an hourly average output of 6.1 GW and relevant baseload, with weekly maximum values of 12.5 GW on Thursday at 8 p.m.
|
- Solar PV was the first source of electricity during 39% of the week, followed by gas (27%) and wind (22%)
- Hourly renewable share fluctuated between 28% and 70% of total generation, a wider variation than observed in the previous week (18% and 78%). Wind's maximum share reached 47% of hourly generation, while solar PV's maximum share reached 62%
|
|
Solar and wind generation
|
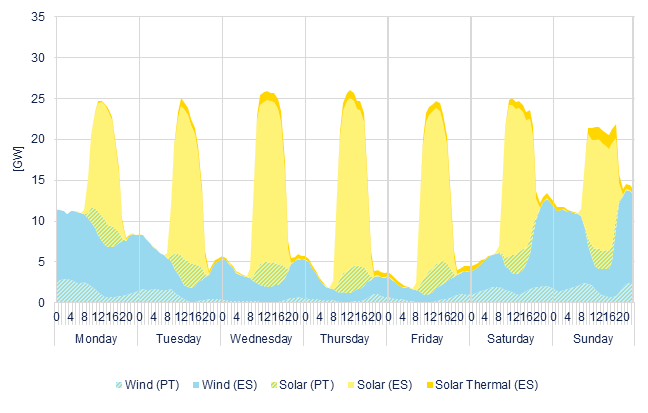
- Wind generation was 0.9 TWh, 19.4% lower than the previous week
- Solar PV generation was 1.2 TWh, 1.9% higher than the previous week
|
|
Generation by technology Iberia
|
|
|
|
|
|
|
Interconnections by country, from Spain
|
|
|
|
|
|
|
Hourly wind & solar generation
|
|
|
|
|
|
Solar PV Price
|
Wind Price
|
|
|
|
|
|
Spain
EUR 32.8/MWh
|
|
Portugal
EUR 31.7/MWh
|
|
|
|
Spain
EUR 64.8/MWh
|
|
Portugal
EUR 61.7/MWh
|
|
|
|
|
|
*The solar / wind price has been calculated as the MD price weighted by the solar / wind generation of the peninsula.
|
|
|
|
|
Futures Market & Commodities
|
|
On the oil market, prices softened after two consecutive weeks of gains, as weaker demand signals weighed against persistent geopolitical risks. Brent crude slipped to USD 66.40/bbl on Thursday, down nearly 2% from the prior week, before recovering marginally to USD 66.85/bbl by Friday. The downturn followed bearish US inventory data, showing rising crude and product stocks, alongside weaker Chinese import figures. Nevertheless, the market remained underpinned by ongoing Ukrainian strikes on Russian refineries and infrastructure, which kept supply concerns elevated heading into the winter period.
|
|
European gas prices retreated modestly, with the TTF front-month declining to EUR 32.75/MWh on Friday, after peaking midweek at EUR 33.25/MWh. Strong LNG send-outs, high renewable generation, and comfortable EU storage levels at 82.6% helped offset temporary disruptions from Norwegian maintenance works. Analysts noted that while the supply outlook remains robust, volatility could resurface with colder weather and further disruptions to pipeline flows.
|
|
European carbon prices extended gains early in the week, with the Dec 25 EUA contract reaching EUR 79.80/t on Wednesday, before easing slightly to close at EUR 78.95/t on Friday. The rally was supported by speculative positioning and continued compliance demand ahead of the September deadline. Investor sentiment remained bullish, with net long positions climbing to fresh highs for the year.
|
|
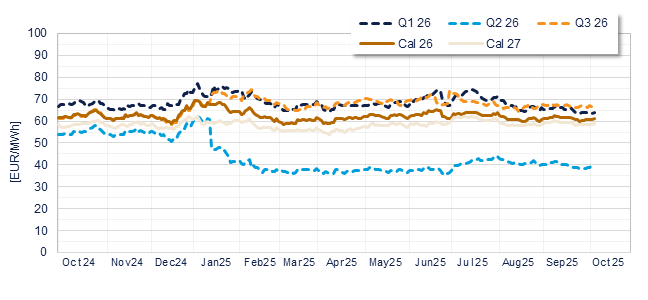
Finally, power futures remained relatively stable. Q1 26 closed decreasing 1.9% at EUR 63.75/MWh, while Q2 26 increased by 3.2% to EUR 40.25/MWh. Q3 26 remained unchanged at EUR 66.45/MWh. For annual contracts, cal 26 rose by 0.25% to EUR 61.2/MWh, and cal 2027 remained unchanged at EUR 58.75/MWh.
|
Why you are receiving this email
|
You are receiving this email because you are subscribed to our Power Markets Weekly report - IBERIA. If you no longer wish to receive this report, or if you would like to subscribe to other regional reports, you can manage your subscription using the button on the right.
|
|
|
|
DNV, Calle Santa Maria Magdalena 14, 28016 Madrid
|
|
|
|
|
This e-mail and any attachments thereto may contain confidential information and/or information protected by intellectual property rights for the exclusive attention of the intended addressees named above. If you have received this transmission in error, please immediately notify the sender by return e-mail and delete this message and its attachments. Unauthorized use, copying or further full or partial distribution of this e-mail or its contents is prohibited.
|
Your
data appears in a file under the responsibility of DNV Maritime and Energy, S.L.U. - NIF: 82800798 Postal address: Calle Santa Maria Magdalena, 14 - Planta 2, 28016, Madrid, E-mail: power-markets-weekly@dnv.com. On behalf of the company we treat the information you provide us with in order to send you market information, information related to our services and invitations to events. The data provided will be kept as long as you do not request the cessation of the activity. The data will not be transferred to third parties except in cases where there is a legal obligation. You have the right to obtain confirmation on whether in DNV GL Services Spain S.L. we are treating your personal data so you have the right to access your personal data, rectify inaccurate data or request its deletion when the data is no longer necessary.
|
DNV GL Services Spain S.L. publishes this weekly report using public information from OMIE, REE y MEFF. This document is for information purposes only. Its partial or total reproduction is authorized while mentioning its source as DNV. Opinions herein expressed are proprietary.
|
|
|