|
|
VOL 8 | NUM 45 | 14 July 2026
|
|
|
|
|
|
|
|
IBERIA | 6 - 12 July 2026
|
|
|
|
Power Markets Weekly
is a brief weekly review of the electric market operation in Chile, Mexico, Iberia, France and Italy. If you are not a subscriber, please feel free to subscribe
here
|
|
|
|
|
|
DNV offers tools for Wholesale Market analysis and operation:
- DNV Power Analytics (DNV-PA) is our web-based platform that provides access to constantly updated long-term energy price forecasts.
- With a refined design and an improved user experience we are upgrading our digital services for our customers.
|
|
|
|
|
|
|
Day‑Ahead prices reached the second highest weekly average of 2026
|
|
|
|
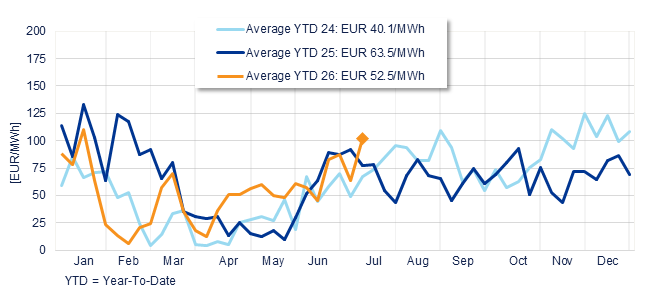
The average price of Day-Ahead Market in Spain reached EUR 102/MWh last week, registering a rise of 61.4% compared to the previous week's average (EUR 63.2/MWh). This weekly price was 32% higher than 2025 (EUR 77.3/MWh) and 51% higher than in 2024 (EUR 67.7/MWh).
|
|
YTD average is EUR 52.5/MWh, -17% lower than YTD value in 2025 (EUR 63.5/MWh) and 31% higher than YTD value in 2024 (EUR 40.1/MWh).
|
|
Annual evolution of the average weekly price of the Spanish Daily Market
|
|
|
|
|
|
|
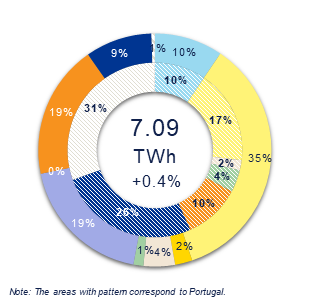
Generation plus imports in Iberia increased by 0.4%, reaching 7.09 TWh, compared to the 7.06 TWh recorded the previous week.
|
|
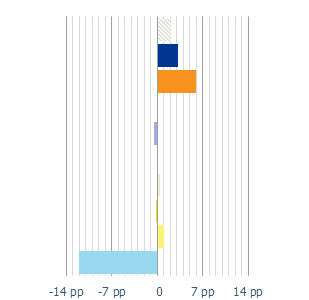
The main changes observed in the energy mix, compared to the previous week, were:
|
- Gas generation increased by 5.9 pp, followed by hydro (3.2 pp), imports (2.2 pp) and solar PV ( 1.0 pp)
- Resulting in share decrease of wind generation (-12.1 pp)
|
|
Global renewable energy share decreased from 66.7% to 58.8% since the previous week.
|
|
Generation Mix Iberia
|
|
|
|
|
Variation Iberia
|
|
|
|
|
|
Nuclear
|
|
Cogeneration
|
|
Renewable thermal
|
|
Coal
|
|
Combined cycle
|
|
|
Hydraulic
|
|
Wind
|
|
Solar PV
|
|
Solar thermal
|
|
Imports
|
|
|
|
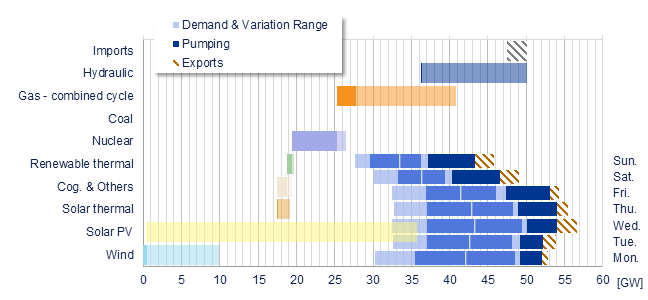
Power range by energy sources vs demand Iberia
|
|
|
|
|
|
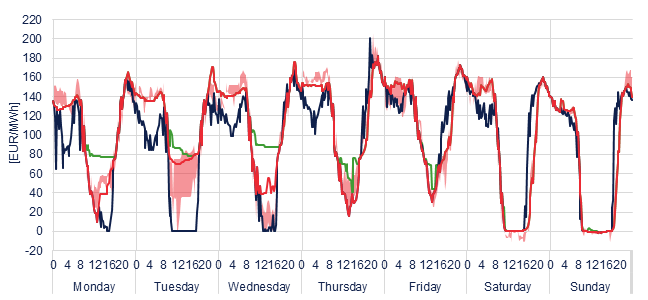
Hourly prices followed a different pattern across Iberia. Until the weekend, prices rarely reached zero during solar hours, remaining above the levels typically observed in recent weeks and supporting higher prices throughout the day.
Meanwhile, French prices fell to floor levels during the first half of the week. Coupling between Spain and Portugal was also weaker than usual, with Portugal decoupling during solar hours from Monday to Friday and ending the week with a higher average price.
|
|
The weekly maximum was EUR 182/MWh, reached on Thursday at 10:00 p.m., coupled with Portugal and France. Minimum price, EUR -1.43/MWh was reached on Sunday at 1:45 p.m., coupled with France.
|
|
The SWE grid coupling was 25%, lower than recorded the previous week, 43%.
|
- Spain-Portugal: 74%
- Spain-France: 40%
- SWE (ES-PT-FR): 25%
|
|
Weekly evolution of the hourly price of the Day-ahead and Intraday Market (DAM and IM)
|
|
|
|
|
|
|
Spanish DAM
EUR 102/MWh
|
|
Spanish IM
EUR 101.4/MWh
|
|
Portugal DAM
EUR 107.7/MWh
|
|
France DAM
EUR 92.4/MWh
|
|
|
|
|
|
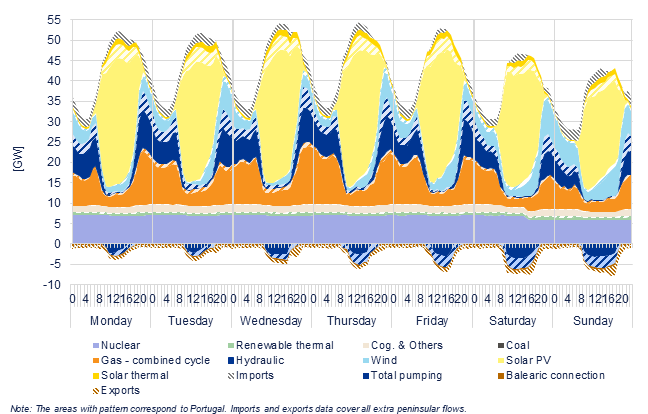
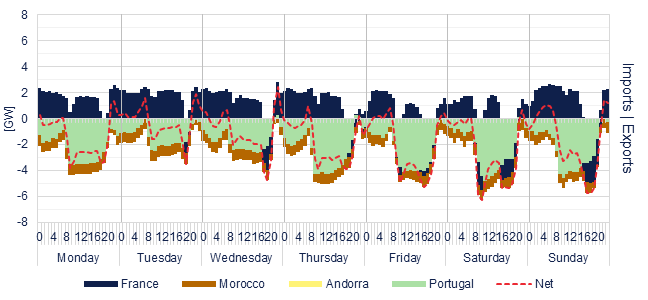
Hourly detail of the generation & interconnections in Iberia
|
|
The highlights from last week
|
- The hourly average output of nuclear generation was 6.8 GW. Vandellos registered a failure on Saturday afternoon, and will remain offline until Saturday 18
- Hydraulic generation provided some night-time peak generation, with almost no baseload generation and relevant pumping. The hourly average production was 5.2 GW
- Gas generation provided an hourly average output of 7.4 GW, with weekly maximum values of 15.5 GW on Wednesday at 11 p.m.
|
- Solar PV was the first source of electricity during 51% of the week, followed by gas (32%) and hydro (12%)
- Hourly renewable share fluctuated between 31% and 76% of total generation, a wider variation than observed in the previous week (45% and 76%). Wind's maximum share reached 25% of hourly generation, while solar PV's maximum share reached 66%
|
|
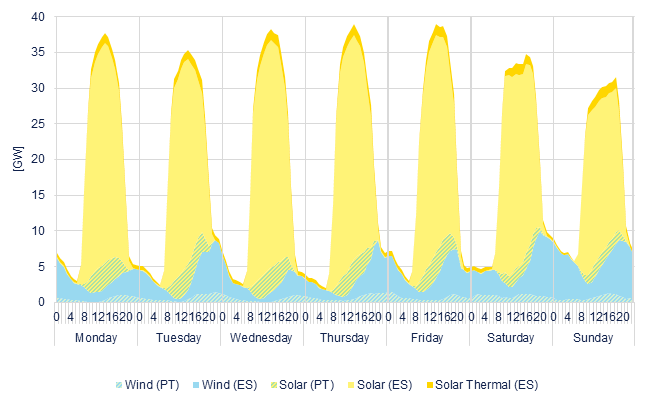
Solar and wind generation
|
- Wind generation was 0.7 TWh, 55.2% lower than the previous week
- Solar PV generation was 2.3 TWh, 3.6% higher than the previous week
|
|
Generation by technology Iberia
|
|
|
|
|
|
|
Interconnections by country, from Spain
|
|
|
|
|
|
|
Hourly wind & solar generation
|
|
|
|
|
|
Solar PV Capture Price
|
Wind Capture Price
|
|
|
|
|
|
Spain
EUR 57.8/MWh
|
|
Portugal
EUR 72.2/MWh
|
|
|
|
Spain
EUR 110.8/MWh
|
|
Portugal
EUR 108.6/MWh
|
|
|
|
|
|
*The solar / wind price has been calculated as the DA price weighted by the solar / wind generation of the peninsula.
|
|
|
|
|
Futures Market & Commodities
|
|
On the oil market, sharply mid‑week after fresh US strikes on Iran and the reimposition of sanctions on Iranian oil exports, fueling fears of renewed supply disruptions. Although markets remained supported by geopolitical uncertainty, gains eased towards the end of the week as traders assessed the outlook for diplomacy and the broader supply-demand balance. Continued weakness in Chinese crude imports and expectations of rising OPEC+ production limited further upside. Overall, settlements increased from USD 71.99/bbl (Monday) to USD 76.01/bbl (Friday), within a range of USD 71.02–80.59/bbl.
|
|
European gas prices were supported by heatwave forecasts across Europe, low storage levels and renewed concerns over LNG flows through the Strait of Hormuz. Prices rose, reaching one‑month highs, as higher cooling demand, lower wind generation and potential constraints on nuclear output increased expectations for gas-fired generation. Strong competition with Asia for LNG cargoes and storage levels remaining well below historical averages continued to underpin the market. Overall, settlements increased from EUR 44.13/MWh (Monday) to EUR 48.66/MWh (Friday), within a range of EUR 41.28–50.36/MWh.
|
|
European carbon prices moved slightly lower, despite remaining close to the EUR 80/t level. Prices reached an 11‑day high early in the week, supported by the return of exceptionally warm temperatures across Europe and expectations of further auction supply cuts. However, gains faded as market participants focused on the upcoming EU ETS reform proposals. Overall, settlements fell from EUR 81.79/t (Monday) to EUR 79.20/t (Friday), within a range of EUR 78.36–82.00/t.
|
|
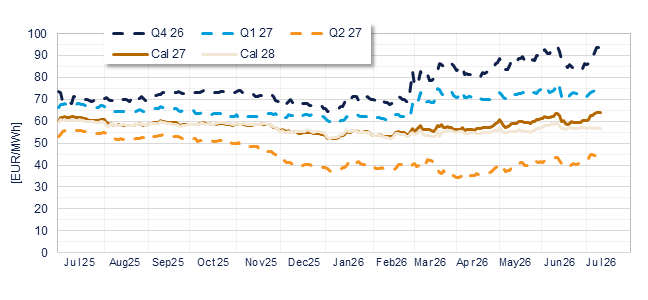
Finally, power futures overall increased. Q4 26 closed rising 5.6% at EUR 93.5/MWh, while Q1 27 rose by 2.3% to EUR 75/MWh. Q2 27 rose by 0.7% to EUR 45.1/MWh. For annual contracts, Cal 27 rose by 2.4% to EUR 64/MWh, and Cal 28 decreased by 0.4% to EUR 56.8/MWh.
|
Why you are receiving this email
|
You are receiving this email because you are subscribed to our Power Markets Weekly report - IBERIA. If you no longer wish to receive this report, or if you would like to subscribe to other regional reports, you can manage your subscription using the button on the right.
|
|
|
|
DNV, Calle Santa Maria Magdalena 14, 28016 Madrid
|
|
|
|
|
This e-mail and any attachments thereto may contain confidential information and/or information protected by intellectual property rights for the exclusive attention of the intended addressees named above. If you have received this transmission in error, please immediately notify the sender by return e-mail and delete this message and its attachments. Unauthorized use, copying or further full or partial distribution of this e-mail or its contents is prohibited.
|
Your
data appears in a file under the responsibility of DNV Maritime and Energy, S.L.U. - NIF: 82800798 Postal address: Calle Santa Maria Magdalena, 14 - Planta 2, 28016, Madrid, E-mail: power-markets-weekly@dnv.com. On behalf of the company we treat the information you provide us with in order to send you market information, information related to our services and invitations to events. The data provided will be kept as long as you do not request the cessation of the activity. The data will not be transferred to third parties except in cases where there is a legal obligation. You have the right to obtain confirmation on whether in DNV GL Services Spain S.L. we are treating your personal data so you have the right to access your personal data, rectify inaccurate data or request its deletion when the data is no longer necessary.
|
DNV GL Services Spain S.L. publishes this weekly report using public information from OMIE, REE y MEFF. This document is for information purposes only. Its partial or total reproduction is authorized while mentioning its source as DNV. Opinions herein expressed are proprietary.
|
|
|