|
|
VOL 7 | NUM 36 | 6 May 2025
|
|
|
|
|
|
|
|
IBERIA | 28 April - 4 May 2025
|
|
|
|
Power Markets Weekly
is a brief weekly review of the electric market operation in Chile, Mexico, Iberia, France and Italy. If you are not a subscriber, please feel free to subscribe
here
|
|
|
|
|
|
DNV offers tools for Wholesale Market analysis and operation:
- DNV Power Analytics (DNV-PA) is our web-based platform that provides access to constantly updated long-term energy price forecasts.
- With a refined design and an improved user experience we are upgrading our digital services for our customers.
|
|
|
|
|
|
|
Major blackout and public holidays disrupt Iberian power system: a week of volatility and record negative Day-Ahead Market prices
|
|
|
|
Last week was marked by a major blackout that occurred on Monday at 12:33, leading to significant disruptions across the Iberian Peninsula and a gradual recovery process that lasted through the week. The incident introduced considerable instability in the system and uncertainty in the data, especially in the hours immediately following the event.
In parallel, public holidays across the peninsula—and additional regional holidays in several Spanish provinces—contributed to a further reduction in electricity demand and overall market activity.
It is important to note that both generation and price data published during this period may be subject to ex post revisions, pending the outcome of the formal investigation currently underway. The CNMC and other relevant authorities are expected to take action based on the final findings.
The following analysis is based on the data available at the time of writing and aims to provide a factual summary of market trends and developments, without speculation.
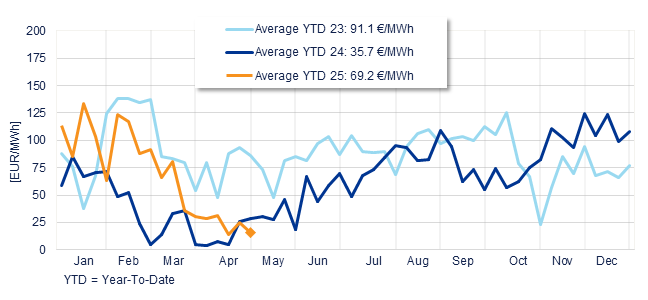
With the data available, the average price of Day-Ahead Market of the whole week in Spain was EUR 15.4/MWh last week, recording a 38% decrease compared to the previous week's average (EUR 24.9/MWh). This weekly price was 46% lower than in 2024 (EUR 28.3/MWh) and 82% lower than in 2023 (EUR 85.7/MWh).
|
|
YTD average was EUR 69.2/MWh, 94% higher than YTD value in 2024 (EUR 35.7/MWh) and 24% lower than YTD value in 2023 (EUR 91.1/MWh).
|
|
Annual evolution of the average weekly price of the Spanish Daily Market
|
|
|
|
|
|
|
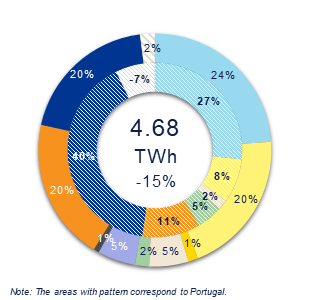
Total generation plus imports in Iberia fell by 15% last week, reaching 4.68 TWh compared to 5.32 TWh the week before. This decline was driven by the widespread public holidays, both national and regional, and the impact of Monday’s blackout.
|
|
At 11 AM on Monday, just before the blackout, the generation mix was heavily dominated by renewables, which accounted for 81% of total output, 56.4% of which came from solar PV.
In contrast, thermal generation was limited, with gas contributing just 3.5% and nuclear 9.7%.
Total generation at that hour stood at 35 GW (29.7 GW in Spain), alongside net exports of 2 GW.
Data immediately after the blackout remains uncertain. Service restoration began around 4 P.M. on Monday in some provinces, with full re-energisation achieved by 4 A.M. on Tuesday. In the absence of official information on the cause of the incident, DNV refrains from commenting on data published during the restoration period.
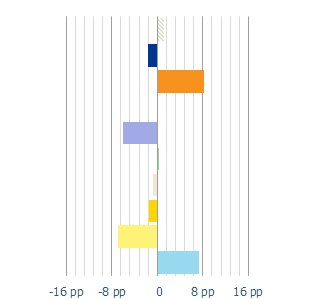
Generation mix data on the days after the blackout (from Tuesday to Sunday included) shows:
|
- Increased output from synchronous sources, especially gas and hydro, was observed (even during the weekend) to stabilise the system.
- In particular, gas generation rose notably, accounting for 19.1% of generation, compared to an average of 9.6% on Monday in the hours before the blackout and 9.9% over the previous week.
- In contrast, nuclear generation remained low and was resumed more gradually, reaching up only to 1.5 GW at the end of Sunday. It had represented 11.1% of generation on Monday before the blackout (and 10.2% the previous week) and dropped to 3.7% from Tuesday to Sunday.
- Solar PV share remained relatively stable around 17% when comparing hours on Monday before the blackout and the period Tuesday to Sunday, though most of the pre-blackout period considered included non-solar hours. The drop in solar PV generation is notable instead when comparing to the previous week, showing a decline of 6.8 pp.
|
|
The global renewable energy share recorded from Tuesday to Sunday was 70.4%, a 5.3 pp decreased compared to the previous week.
|
|
Generation Mix Iberia
|
|
|
|
|
Variation Iberia
|
|
|
|
|
|
Nuclear
|
|
Cogeneration
|
|
Renewable thermal
|
|
Coal
|
|
Combined cycle
|
|
|
Hydraulic
|
|
Wind
|
|
Solar PV
|
|
Solar thermal
|
|
Imports
|
|
|
|
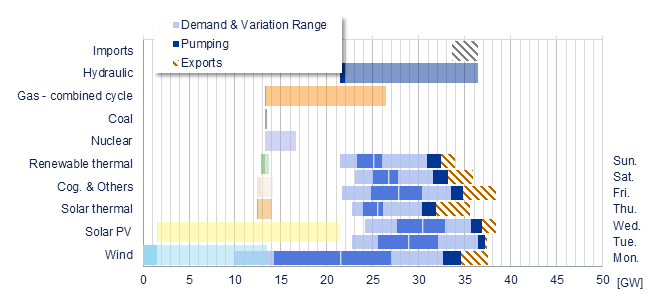
Power range by energy sources vs demand Iberia
|
|
|
|
|
|
|
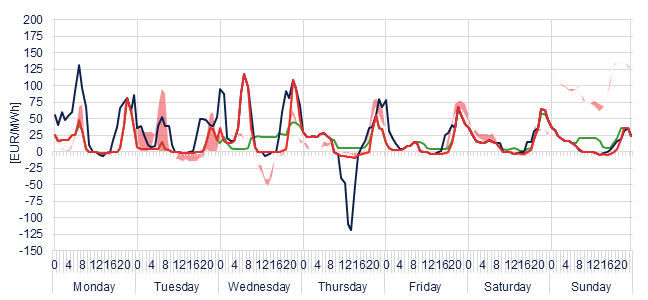
DAM price at 11 A.M. on Monday, before the blackout, was EUR -0.01/MWh across Spain, Portugal and France due to the high renewable penetration at that time. The Intraday price in Spain was EUR -0.01/MWh.
|
|
Without commenting prices on Tuesday and Wednesday that may be affected by the blackout aftermath, prices for the second half of the week showed a level of instability.
|
- Starting Thursday, significant negative DAM prices were recorded daily in the middle of the day, hitting a record low of EUR -10/MWh on Thursday at 3 P.M.
- Meanwhile, evening peak prices rose above EUR 30/MWh, even exceeding EUR 60/MWh in some intervals, despite the public holidays and typically lower weekend demand. The maximum price was EUR 67.05/MWh, recorded on Friday at 9 P.M.
|
|
The SWE grid coupling was 23% (the previous week value was 21%), with a large drop of the Spain-Portugal coupling and significant increase in the Spain-France coupling:
|
- Spain-Portugal: 54% (previous week: 97%)
- Spain-France: 42% (previous week 22%)
- SWE (ES-PT-FR): 23%
|
|
Weekly evolution of the hourly price of the Day-ahead and Intraday Market (DAM and IM)
|
|
|
|
|
|
|
Spanish DAM
EUR 15.4/MWh
|
|
Spanish IM
EUR 27.2/MWh
|
|
Portugal DAM
EUR 16.5/MWh
|
|
France DAM
EUR 25.2/MWh
|
|
|
|
|
|
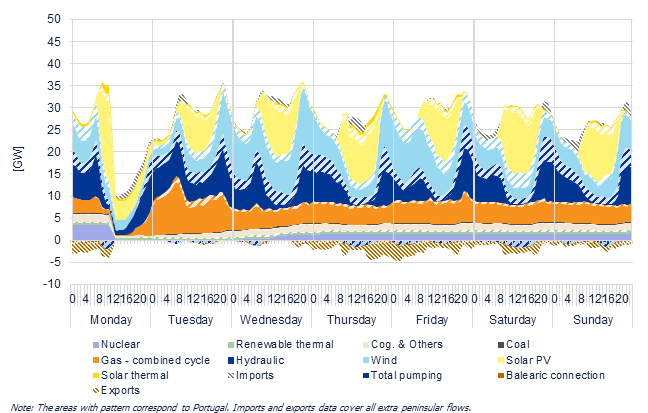
Hourly detail of the generation & interconnections in Iberia
|
|
The highlights from last week
|
- The hourly average nuclear output was around 3.4 GW in the hours preceding the blackout. Recovery of the nuclear fleet was gradual, with output restarting late Tuesday night at below 100 MW and rising gradually to reach a peak of 1.57 GW by Sunday at 11 PM. Only Ascó I and Vandellós remained available during the days following the blackout.
- Before the blackout, gas output averaged 2.9 GW. It then rose significantly throughout the rest of the week to support baseload generation, averaging 5.5 GW from Tuesday to Sunday.
- Hydro generation also played a key role post-blackout, especially during non-solar hours. From Tuesday to Sunday, average hydro output was 6.9 GW, with peaks reaching nearly 15 GW.
|
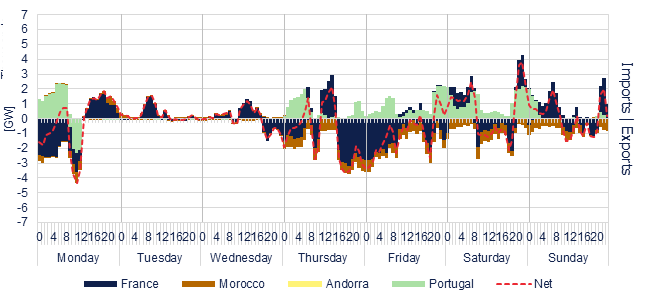
- Prior to the blackout, Spain was a net exporter to Portugal, France, and Morocco.
- After the incident, imports from France (and to a lesser extent, Morocco) continued. Portugal remained disconnected from Spain until Thursday, after which it began exporting to Spain but never resumed imports from Spain during the week. Spain also resumed exports to France and Morocco during certain hours from Thursday onwards.
|
|
Solar and wind generation
|
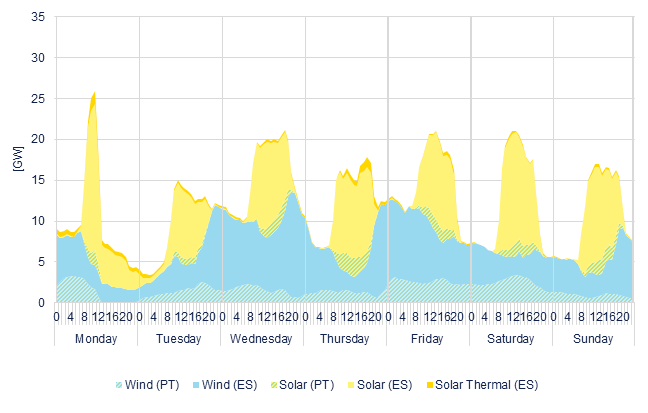
- Wind output remained stable before and after the blackout, with an average of 7.3 GW.
- On Monday between 8 A.M. and 11 A.M., solar PV generation averaged 15 GW. From Tuesday to Sunday, average solar output between 8 A.M. and 8 P.M. was 9 GW.
|
|
Generation by technology Iberia
|
|
|
|
|
|
|
Interconnections by country, from Spain
|
|
|
|
|
|
|
Hourly wind & solar generation
|
|
|
|
|
|
Solar PV Price
|
Wind Price
|
|
|
|
|
|
Spain
EUR 2/MWh
|
|
Portugal
EUR 9.5/MWh
|
|
|
|
Spain
EUR 19.6/MWh
|
|
Portugal
EUR 14.7/MWh
|
|
|
|
|
|
*The solar / wind price has been calculated as the MD price weighted by the solar / wind generation of the peninsula.
|
|
|
|
|
Futures Market & Commodities
|
|
On the oil market, prices continued to decline due to trade war and growth concerns. On Thursday, it reached a low of USD 59.3/bbl, closing the week at USD 61.29/bbl. It decreased about 7% for the week and approximately 13% this month after U.S. President Donald Trump announced a series of tariffs on imports from its trading partners. Investor sentiment remains affected by a weak demand outlook as the global economy deals with the ongoing trade war and concerns of market oversupply. The OPEC+ alliance will meet on May 5 to decide on production policy.
|
|
European gas prices remained steady despite hitting a new 9-month low on Tuesday at EUR 31.34/MWh. The markets adopted a “wait-and-see” stance as storage injections increased, with the EU seemed to favour flexible injection plans to adapt the November target of 90% storage capacity. The reduced demand for LNG in Asia is facilitating these injections: European storage sites were last reported at 39.5%, an increase of 1.6 pp week on week. However, one year ago, storages were filled at 62.4%. Additionally, May will see significant seasonal maintenance work at Norwegian fields and processing plants, which will reduce supply to both the UK and continental Europe.
|
|
European carbon prices in contrast to the other commodities, ended 4% on the week, closing at a one month high at EUR 68.76/t. Nevertheless, EUAs plunged to a low of EUR 60.07/t in early April following the US’s announcement of tariffs on key trading partners. A total of 8.6m EUAs were successfully auctioned between Monday and Wednesday at an average price of EUR 64.27/t and an average cover ratio of 1.52. The absence of primary auctions on Thursday and Friday may have contributed to higher EUA prices in the latter part of the week.
|
|
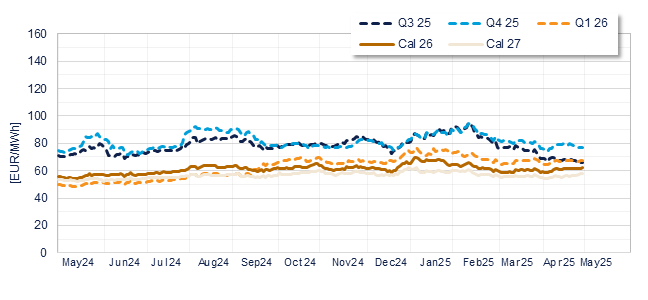
To conclude, futures had an overall positive performance except for Q3 25, which dropped by 2.1% to close at EUR 66.15/MWh. Q4 25 and Q1 26 rose by 4.2% and 2.3%, to end the week at EUR 76.75/MWh and EUR 67.25/MWh, respectively. On the yearly front, cal 26 increased by 2.5%, closing at EUR 62.15/MWh, while cal 27 slightly rose to 0.5% and closed at EUR 57.73/MWh.
|
Why you are receiving this email
|
You are receiving this email because you are subscribed to our Power Markets Weekly report - IBERIA. If you no longer wish to receive this report, you can opt-out of this email using the button on the right.
|
|
|
|
DNV, Calle Santa Maria Magdalena 14, 28016 Madrid
|
|
|
|
|
This e-mail and any attachments thereto may contain confidential information and/or information protected by intellectual property rights for the exclusive attention of the intended addressees named above. If you have received this transmission in error, please immediately notify the sender by return e-mail and delete this message and its attachments. Unauthorized use, copying or further full or partial distribution of this e-mail or its contents is prohibited.
|
Your
data appears in a file under the responsibility of DNV Maritime and Energy, S.L.U. - NIF: 82800798 Postal address: Calle Santa Maria Magdalena, 14 - Planta 2, 28016, Madrid, E-mail: power-markets-weekly@dnv.com. On behalf of the company we treat the information you provide us with in order to send you market information, information related to our services and invitations to events. The data provided will be kept as long as you do not request the cessation of the activity. The data will not be transferred to third parties except in cases where there is a legal obligation. You have the right to obtain confirmation on whether in DNV GL Services Spain S.L. we are treating your personal data so you have the right to access your personal data, rectify inaccurate data or request its deletion when the data is no longer necessary.
|
DNV GL Services Spain S.L. publishes this weekly report using public information from OMIE, REE y MEFF. This document is for information purposes only. Its partial or total reproduction is authorized while mentioning its source as DNV. Opinions herein expressed are proprietary.
|
|
|