|
|
VOL 13 | NUM 11 | 2 October 2026
|
|
|
|
|
|
|
|
CHILE | 21 - 27 September 2026
|
|
|
|
Power Markets Weekly
is a brief weekly review of the electric market operation in Chile, Mexico, Iberia, France and Italy. If you are not a subscriber, please feel free to subscribe
here
|
|
|
|
|
|
DNV offers tools for Wholesale Market analysis and operation:
- DNV Power Analytics (DNV-PA) is our web-based platform that provides access to constantly updated long-term energy price forecasts.
- With a refined design and an improved user experience we are upgrading our digital services for our customers.
|
|
|
|
|
|
|
September ends, Charrúa-Ancoa congestion doesn’t
|
|
|
|
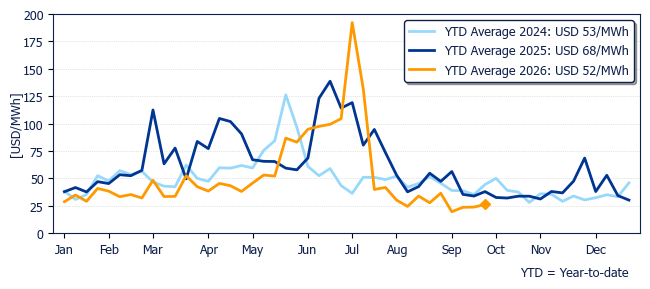
The average price in Polpaico reached USD 26.2/MWh. This was 10% higher than last week and 31% lower compared to one year ago.
|
|
Marginal cost evolution in Polpaico during past years
|
|
|
|
|
|
|
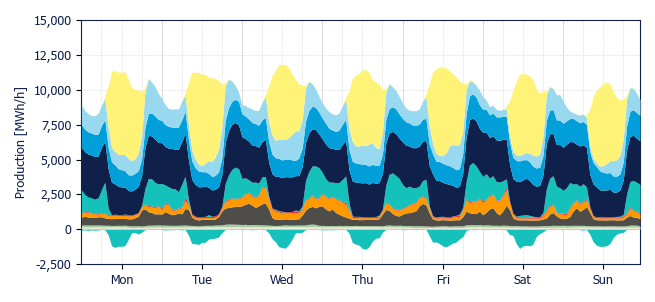
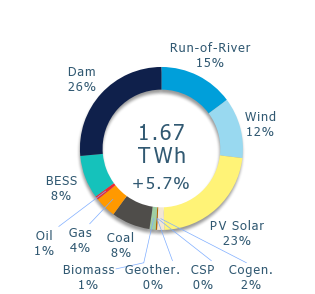
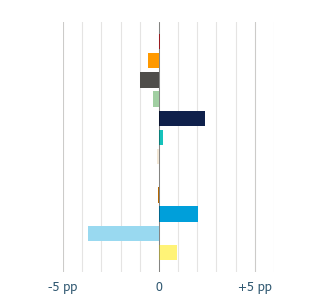
The generation mix presented moderate changes compared to the previous week. Regarding fossil-fueled generation, coal decreased its share by 1.0 pp, while gas decreased by 0.6 pp.
|
|
Hydropower generation gained share, with run-of-river and dam generation rising by 2.0 pp and 2.4 pp.
|
|
Regarding renewables, wind decreased by 3.7 pp, whereas solar PV gained 0.9 pp.
|
|
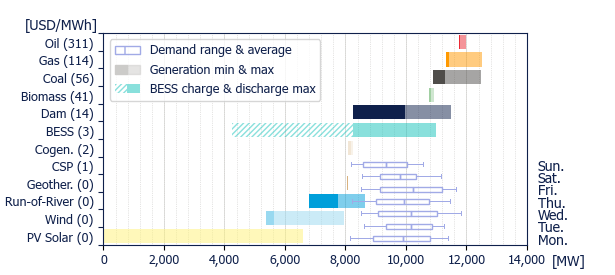
Peak demand in the system reached 11.8 GW at 1 pm on Wednesday. At that time, wind and solar generation jointly accounted for 57.5% of the generation mix.
|
|
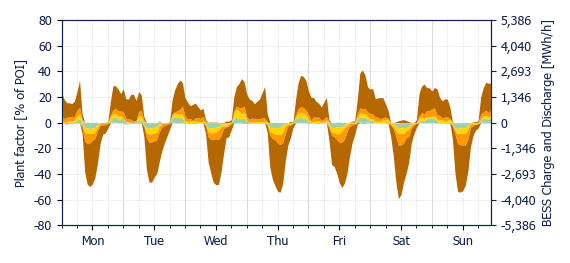
BESS participation peaked at 9 pm on Friday, accounting for 26.0% of the system’s generation mix, with an output of 2.6 GW.
|
|
Generation Mix
|
|
|
|
|
Variation
|
|
|
|
|
Power range by energy sources (average prices)
|
|
|
|
|
|
|
|
|
|
|
|
|
|
Geothermal
|
|
Cogeneration
|
|
Biomass
|
|
Coal
|
|
|
Gas
|
|
Oil
|
|
BESS
|
|
Dam
|
|
|
Run-of-river
|
|
Wind
|
|
PV Solar
|
|
CSP
|
|
|
|
|
|
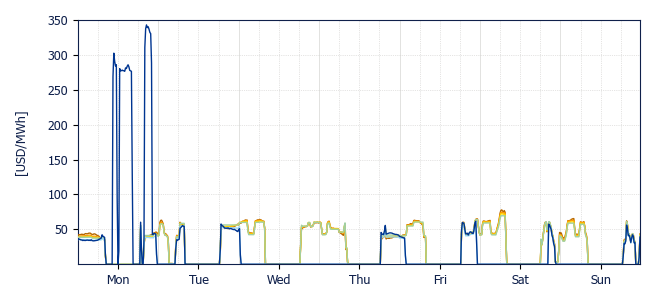
Prices kept a similar behaviour compared to last week, with the usual congestion in the southern areas:
|
- 500kV Charrúa – Ancoa line congested every day of the week at morning and night and even for a few minutes on Thursday mid-day. This caused a price decoupling in the system, with prices in Charrúa to the south, falling to USD 0/MWh for several hours cause of the high wind generation in the area. This extended to most of the weekend.
- 220kV Lastarria – Ciruelos line congested from Monday to Thursday, both in solar and non-solar hours. This congestion price-decoupled Puerto Montt, forcing once again the operation of oil-fired Trapén power plant to meet the demand, setting a peak price of the week of USD 332.7/MWh at 9 AM of Thursday.
- 220kV Charrúa – Santa Clara line congested on Tuesday during solar hours, dropping prices to USD 0/MWh in Santa Clara and Cautín, however, given a congestion in 220kV Cautín-Ciruelos line at the time, Puerto Montt remained with high prices.
|
|
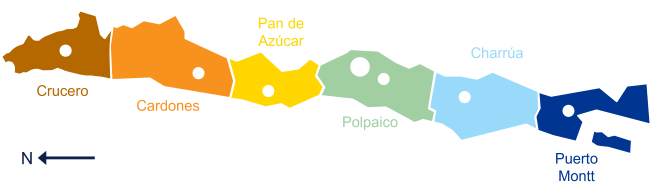
These congestions affected mostly the south-centre and south areas of the SEN, represented by Charrúa and Puerto Montt, respectively. The rest of the reference nodes of the SEN remained coupled.
|
|
In total, the number of USD 0/MWh hours was 64 for the reference nodes Crucero, Cardones, Pan de Azúcar, and Polpaico; 110 for Charrúa; and 77 for Puerto Montt.
|
|
Among the main operational events observed during the week:
|
- On Wednesday, a fault on the Charrúa–Quilleco 220 kV transmission line resulted in a 305 MW generation loss, with system frequency falling to a minimum of 49.51 Hz.
- On Saturday, a fault at Florida 110 kV substation led to the interruption of approximately 232 MW of demand.
- In addition, PFV + BESS Huatacondo remained disconnected during the week following a reported cyberattack.
|
|
|
|
|
|
|
Crucero
USD 26.6/MWh
|
|
Cardones
USD 26.4/MWh
|
|
Pan de Azúcar
USD 26.2/MWh
|
|
|
|
|
Polpaico
USD 26.2/MWh
|
|
Charrúa
USD 9.7/MWh
|
|
Puerto Montt
USD 22.6/MWh
|
|
|
|
|
|
Solar and Wind production & BESS dispatch
|
|
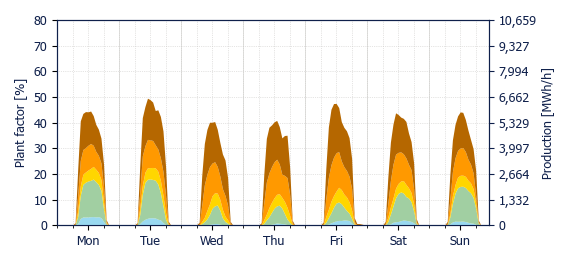
Solar output increased by 10.3% | 35.2 GWh compared to last week. Regarding the plant factor, the highest was 19.9% in Cardones, while the lowest was 10.8% in Puerto Montt. The system-wide solar plant factor was 16.8%.
|
|
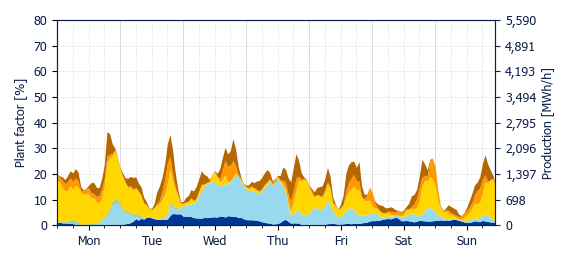
Wind generation decreased this week by 19.2% | 47.7 GWh relative to last week. The highest plant factor was 30.0% in Puerto Montt, while the lowest was 6.1% in Cardones. The system-wide wind plant factor was 17.1%.
|
|
BESS showed an increase in injection of 8.5% | 11.2 GWh, and a rise in charging by 4.5% | 6.8 GWh, relative to last week. Injections continue to occur predominantly before midnight, resulting in a significant reduction in BESS injections during the early morning hours.
|
|
This week, curtailment rates reached 18.2% | 45.2 GWh for wind and 15.1% | 76.3 GWh for solar. This resulted in a combined system-wide curtailment rate of 16.0%, which represents a decrease of 1.1 pp relative to last week.
|
|
|
|
|
|
|
|
|
|
|
|
|
|
|
|
|
Crucero
USD 2.2/MWh
|
|
Cardones
USD 1.7/MWh
|
|
Pan de Azúcar
USD 1.6/MWh
|
|
|
|
|
Polpaico
USD 1.1/MWh
|
|
Charrúa
USD 0.8/MWh
|
|
Puerto Montt
USD 49.7/MWh
|
|
|
|
|
Energy weighted average spot price using PV production by zone
|
|
|
|
|
|
|
Crucero
USD 26.3/MWh
|
|
Cardones
USD 21.8/MWh
|
|
Pan de Azúcar
USD 28.0/MWh
|
|
|
|
|
Polpaico
USD 28.2/MWh
|
|
Charrúa
USD 5.8/MWh
|
|
Puerto Montt
USD 10.0/MWh
|
|
|
|
|
Energy weighted average spot price using wind production by zone
|
|
|
|
BESS discharge capture price
|
|
|
|
|
Crucero
USD 45.1/MWh
|
|
Cardones
USD 45.5/MWh
|
|
Pan de Azúcar
USD 47.0/MWh
|
|
|
|
|
Polpaico
USD 43.4/MWh
|
|
Charrúa
USD 28.8/MWh
|
|
|
|
|
Energy weighted average spot price using BESS discharge by zone
|
|
|
|
BESS charge capture price
|
|
|
|
|
Crucero
USD 0.7/MWh
|
|
Cardones
USD 0.5/MWh
|
|
Pan de Azúcar
USD 0.3/MWh
|
|
|
|
|
Polpaico
USD 2.5/MWh
|
|
Charrúa
USD 6.6/MWh
|
|
|
|
|
Energy weighted average spot price using BESS charge (both from co-located power plant and from grid) by zone
|
|
|
|
|
|
DNV, Magdalena 181, Las Condes, Santiago, Chile
|
|
|
|
|
|
|