|
|
VOL 12 | NUM 6 | 29 August 2025
|
|
|
|
|
|
|
|
CHILE | 18 - 24 August 2025
|
|
|
|
Power Markets Weekly
is a brief weekly review of the electric market operation in Chile, Mexico, Iberia, France and Italy. If you are not a subscriber, please feel free to subscribe
here
|
|
|
|
|
|
DNV offers tools for Wholesale Market analysis and operation:
- DNV Power Analytics (DNV-PA) is our web-based platform that provides access to constantly updated long-term energy price forecasts.
- With a refined design and an improved user experience we are upgrading our digital services for our customers.
|
|
|
|
|
|
|
Ckhúri wind power plant begins commissioning, with full operation expected in the coming months
|
|
|
|
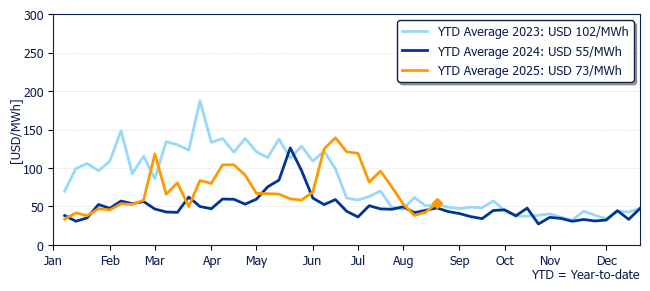
Average price in Polpaico rose to USD 54.7/MWh, 29% higher than last week, and 14% higher than the same week last year
|
|
Marginal cost evolution in Polpaico during past years
|
|
|
|
|
|
|
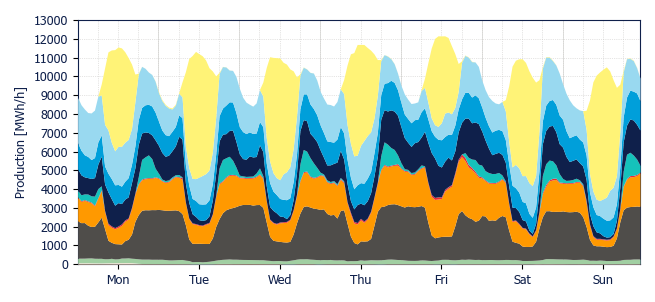
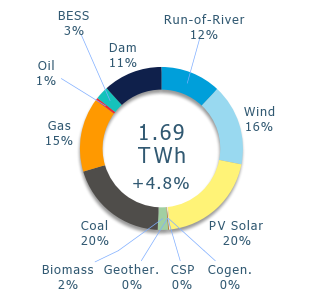
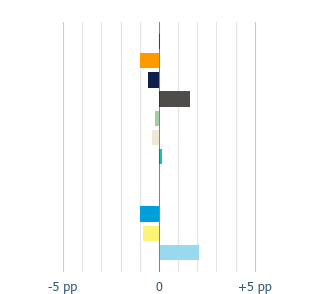
In terms of the generation mix, there were no drastic changes. Wind and BESS increased their share by 2.1 pp and 0.2 pp, respectively, while solar decreased its own by 0.8 pp. Less hydro participation was seen as both run-of-river and dam, decreased their share by 1.0 pp and 0.6 pp, respectively.
|
|
Regarding thermal sources, coal increased its share by 1.6 pp, while gas reduced its own by 1.0 pp. Overall, renewables accounted for 65.1% of the mix.
|
|
Notably, this week the 109.2 MW Ckhúri wind power plant began its commissioning process. Although current injections are low, the plant is expected to become fully operational in the coming months. The plant will inject in the "El Abra 220 kV" node, located in the Far North area of the SEN.
|
|
A 4.8% increase in demand was seen this week, given that the past week had a holiday, unlike this one. Also, demand peak was reached at 12 PM of Friday, reaching 12.2 GWh/h. In that moment, wind and solar accounted for 45.3% of the supply (BESS injections were not present at the time).
|
|
Generation Mix
|
|
|
|
|
Variation
|
|
|
|
|
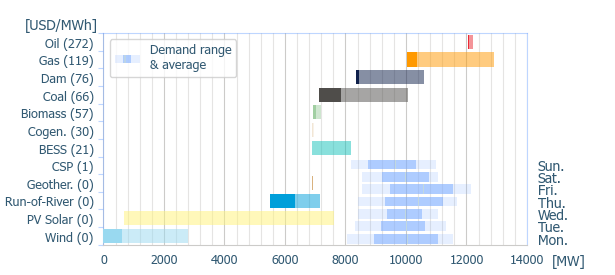
Power range by energy sources (average prices)
|
|
|
|
|
|
|
|
|
|
|
|
|
|
Geothermal
|
|
Cogeneration
|
|
Biomass
|
|
Coal
|
|
|
Gas
|
|
Oil
|
|
BESS
|
|
Dam
|
|
|
Run-of-river
|
|
Wind
|
|
PV Solar
|
|
CSP
|
|
|
|
|
|
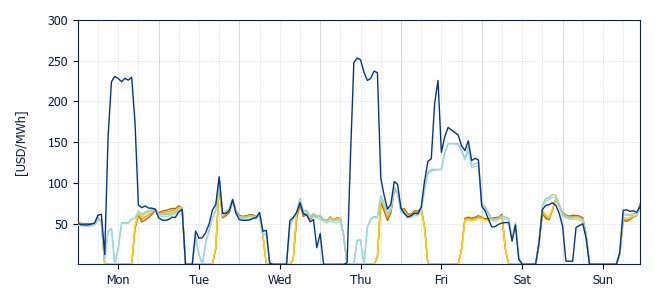
Some main system transmission lines congested during the week, decoupling different areas, as follows:
|
- From Monday to Saturday during solar hours, the 500 kV Nueva Pan de Azúcar – Polpaico line decoupled the system south of Polpaico. On Friday, a specific restriction on the line, caused by climatic conditions, limited energy flow between Polpaico and Pan de Azúcar.
|
|
Due to this constrain, solar and wind output was curtailed in the northern areas, and gas generation was required to meet nighttime demand in the central areas, given that there was also a low wind availability at the time. It is worth noting that BESS injections in the northern areas were present from Friday night to Saturday morning, supplying the required energy in the area.
|
- 220 kV Charrúa - Santa Clara line from Wednesday night to Thursday morning, decoupled Puerto Montt, causing it to drop the prices to USD 0/MWh, given the high renewable availability of the moment.
- 220 kV Lastarria – Ciruelos line on Monday, Tuesday, Thursday and Sunday. Also 220 kV Rio Malleco – Cautín line, on Friday. Both congested during solar hours, decoupling Puerto Montt from the rest of the system.
|
|
These last congestions on solar hours in Puerto Montt, forced the demand to be met by diesel power plants, driving up local prices. As a result, at 11 AM on Thursday, Puerto Montt registered the weekly peak price of the system, that reached USD 253.3/MWh.
|
|
Zero price hours were seen all through the system: 63 hours in Crucero, Diego de Almagro and Pan de Azúcar. 28 hours in Polpaico and Charrúa, and 29 hours in Puerto Montt.
|
|
|
|
|
|
|
Crucero
USD 35.8/MWh
|
|
D. de Almagro
USD 35.8/MWh
|
|
Pan de Azúcar
USD 35.9/MWh
|
|
|
|
|
Polpaico
USD 54.7/MWh
|
|
Charrúa
USD 53.3/MWh
|
|
Puerto Montt
USD 73.0/MWh
|
|
|
|
|
|
Solar and Wind production & BESS dispatch
|
|
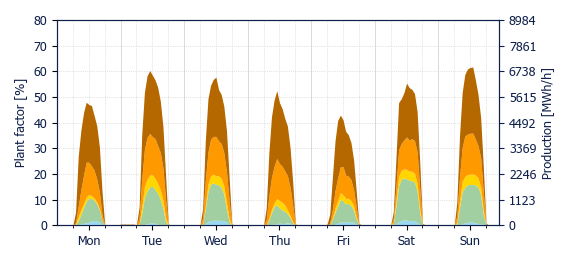
Solar generation remained stable this week with only a 0.7% increase (+2.4 GWh). The maximum average plant factor was in Crucero area with 23.9%, while the lowest were seen in southern areas like Puerto Montt (7.4%) and Charrúa (13.1%). The average solar plant factor of the system was 18.1%
|
|
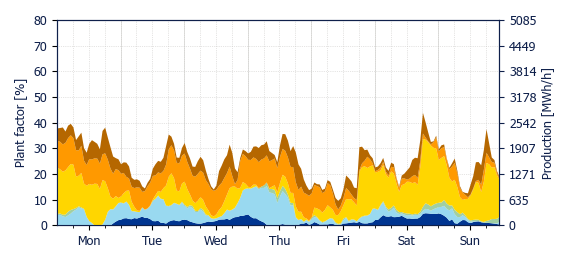
On the other hand, wind had a notable increase of 20.5% (+46.5 GWh). The maximum average plant factor was observed in Diego de Almagro area with 33.8%, while the lowest was at Charrúa area with 16.8%. The average wind plant factor of the system was 25.6%.
|
|
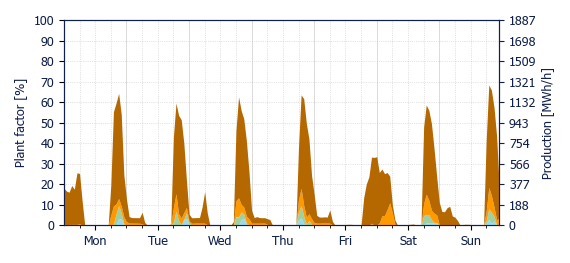
BESS injections totalled 44.5 GWh, meaning an 11.7% increase since last week. The Crucero area had the highest increase of 5.2 GWh, while the center had the main decrease of 0.4 GWh.
|
|
This week, the curtailment rate was 10.8% for wind and 18.9% for solar, reaching an average curtailment rate of 15.5% (similar to the past week average curtailment rate of 14.9%).
|
|
|
|
|
|
|
|
|
|
|
|
|
|
|
|
|
Crucero
USD 2.4/MWh
|
|
D. de Almagro
USD 2.0/MWh
|
|
Pan de Azúcar
USD 1.5/MWh
|
|
|
|
|
Polpaico
USD 25.4/MWh
|
|
Charrúa
USD 34.7/MWh
|
|
Puerto Montt
USD 82.1/MWh
|
|
|
|
|
Energy weighted average spot price using PV production by zone
|
|
|
|
|
|
|
Crucero
USD 33.8/MWh
|
|
D. de Almagro
USD 37.8/MWh
|
|
Pan de Azúcar
USD 39.4/MWh
|
|
|
|
|
Polpaico
USD 51.0/MWh
|
|
Charrúa
USD 49.0/MWh
|
|
Puerto Montt
USD 48.1/MWh
|
|
|
|
|
Energy weighted average spot price using wind production by zone
|
|
|
|
BESS discharge capture price
|
|
|
|
|
Crucero
USD 60.7/MWh
|
|
D. de Almagro
USD 63.0/MWh
|
|
Pan de Azúcar
USD 70.1/MWh
|
|
|
|
|
Polpaico
USD 70.0/MWh
|
|
Charrúa
USD 68.1/MWh
|
|
|
|
|
Energy weighted average spot price using BESS injection by zone
|
|
|
|
|
|
DNV, Magdalena 181, Las Condes, Santiago, Chile
|
|
|
|
|
|
|