|
|
VOL 12 | NUM 52 | 17 July 2026
|
|
|
|
Power Markets Weekly
is a brief weekly review of the electric market operation in Chile, Mexico, Iberia, France and Italy. If you are not a subscriber, please feel free to subscribe
here
|
|
|
|
|
|
DNV offers tools for Wholesale Market analysis and operation:
- DNV Power Analytics (DNV-PA) is our web-based platform that provides access to constantly updated long-term energy price forecasts.
- With a refined design and an improved user experience we are upgrading our digital services for our customers.
|
|
|
|
|
|
|
Forecast Rainfall Eases Market Conditions
|
|
|
|
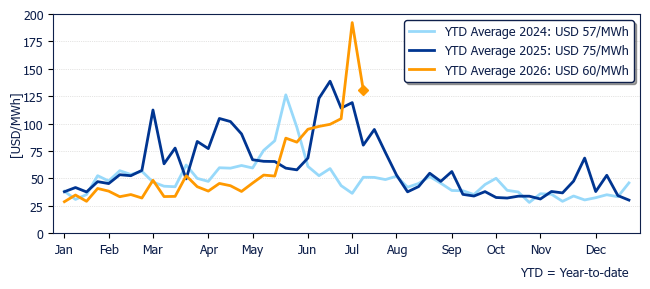
The average price in Polpaico was USD 130.8/MWh, with a big drop of 31.9% from last week and 62.8% higher than the same week one year ago.
|
|
Marginal cost evolution in Polpaico during past years
|
|
|
|
|
|
|
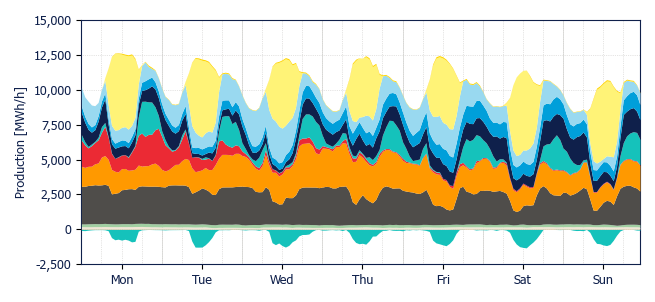
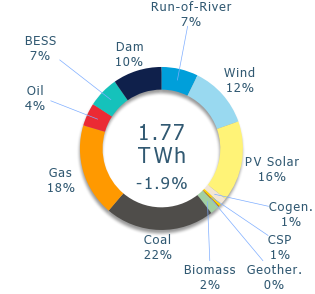
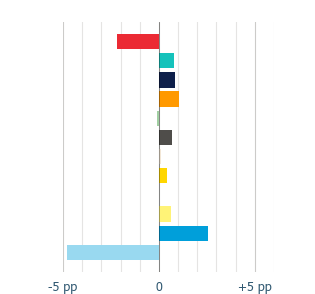
This week, the thermal generation share decreased by 0.4 pp, mainly driven by a 2.2 pp decline in oil-fired generation. Meanwhile, gas- and coal-fired generation returned to more typical operating levels following events of last week, increasing their shares by 1.1 pp and 0.7 pp, respectively.
|
|
Hydro increased its share, with both dam and run-of-river rising by 0.9 pp and 2.9 pp, respectively.
|
|
Solar share increased by 0.6 pp this week, while wind share decreased by 4.8 pp.
|
|
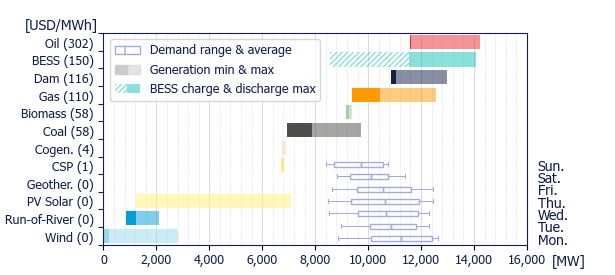
Generation peaked at 12.6 GW on Monday at 11 AM, with solar, wind and CSP accounting for 50.2% of the total output at that hour.
|
|
BESS injection to the system peaked at 7 PM on Monday, representing 20.9% of the total output at that hour.
|
|
Generation Mix
|
|
|
|
|
Variation
|
|
|
|
|
Power range by energy sources (average prices)
|
|
|
|
|
|
|
|
|
|
|
|
|
|
Geothermal
|
|
Cogeneration
|
|
Biomass
|
|
Coal
|
|
|
Gas
|
|
Oil
|
|
BESS
|
|
Dam
|
|
|
Run-of-river
|
|
Wind
|
|
PV Solar
|
|
CSP
|
|
|
|
|
|
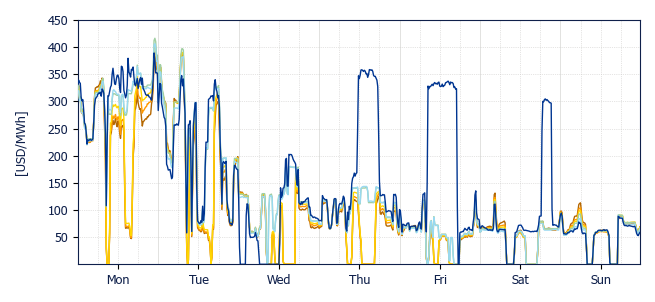
This week, marginal costs peaked at USD 416.4/MWh in Polpaico on Monday at 11 PM. At that time, Pajonales, an oil-fired power plant, was setting the system-wide marginal cost. High marginal costs during the first half of the week reflected the tight operating conditions caused by low hydro availability and gas supply constraints observed over the previous weeks.
|
|
On the other hand, rainfall began in southern Chile on Wednesday, increasing dam inflows and helping ease system conditions by improving water availability while alleviating the tight gas and hydro supply observed earlier in the week and the previous weeks. Nevertheless, this rainfall is not yet sufficient by itself to resolve the broader hydrological deficit, making the forecast precipitation over the south-central region particularly important in the coming days.
|
|
Despite the overall improvement, Puerto Montt continued to experience isolated price spikes due to congestions on the 220 kV Lastarria–Ciruelos transmission line, which periodically separated the southern area from the rest of the system on Thursday, Friday and Saturday.
|
|
In addition, the 500 kV Nueva Pan de Azúcar–Polpaico line experienced congestion almost every day this week, except on Saturday and Sunday, in solar hours.
|
|
|
|
|
|
|
Crucero
USD 103.3/MWh
|
|
Cardones
USD 105.1/MWh
|
|
Pan de Azúcar
USD 107.7/MWh
|
|
|
|
|
Polpaico
USD 130.8/MWh
|
|
Charrúa
USD 129.0/MWh
|
|
Puerto Montt
USD 155.5/MWh
|
|
|
|
|
|
Solar and Wind production & BESS dispatch
|
|
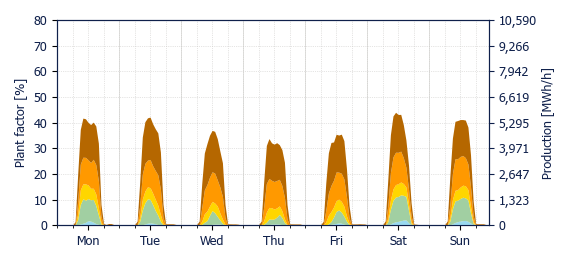
Solar output increased by 2.1% | 5.8 GWh compared to last week. Regarding the plant factor, the highest was 17.9% in Cardones, while the lowest was 4.9% in Puerto Montt. The system-wide solar plant factor was 12.7%.
|
|
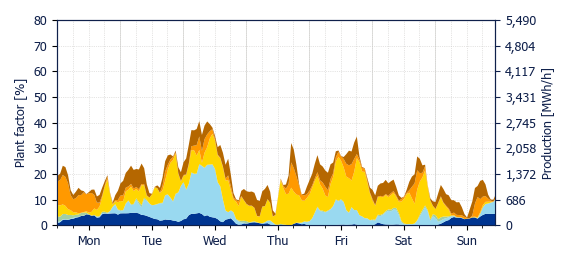
Wind generation decreased this week by 29.3% | 90.4 GWh relative to last week. The highest plant factor was 35.7% in Puerto Montt, while the lowest was 8.1% in Cardones. The system-wide wind plant factor was 18.9%.
|
|
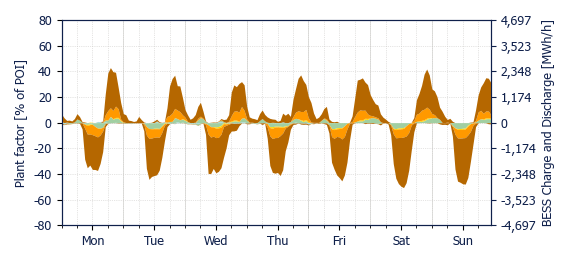
BESS showed an increase in injections of 12.1% | 11.8 GWh, and an increase in charges by 19.1% | 20.5 GWh, relative to last week. Based on the hourly BESS dispatch profile, injections continue to occur predominantly before midnight, resulting in a significant reduction in BESS injections during the early morning hours. Also they keep increasing in its injections to the system, with a record reached this week of 2.5 GW at 8 PM on Monday.
|
|
This week, curtailment rates reached 3.2% | 7.3 GWh for wind and 3.6% | 13.0 GWh for solar. This resulted in a combined system-wide curtailment rate of 3.5%, which represents an increase of 1.3 pp relative to last week.
|
|
|
|
|
|
|
|
|
|
|
|
|
|
|
|
|
Crucero
USD 62.3/MWh
|
|
Cardones
USD 62.1/MWh
|
|
Pan de Azúcar
USD 73.8/MWh
|
|
|
|
|
Polpaico
USD 123.8/MWh
|
|
Charrúa
USD 108.7/MWh
|
|
Puerto Montt
USD 171.2/MWh
|
|
|
|
|
Energy weighted average spot price using PV production by zone
|
|
|
|
|
|
|
Crucero
USD 103.0/MWh
|
|
Cardones
USD 129.7/MWh
|
|
Pan de Azúcar
USD 84.5/MWh
|
|
|
|
|
Polpaico
USD 168.7/MWh
|
|
Charrúa
USD 111.8/MWh
|
|
Puerto Montt
USD 168.9/MWh
|
|
|
|
|
Energy weighted average spot price using wind production by zone
|
|
|
|
BESS discharge capture price
|
|
|
|
|
Crucero
USD 114.4/MWh
|
|
Cardones
USD 119.3/MWh
|
|
Pan de Azúcar
USD 126.7/MWh
|
|
|
|
|
Polpaico
USD 129.7/MWh
|
|
Charrúa
USD 178.6/MWh
|
|
|
|
|
Energy weighted average spot price using BESS discharge by zone
|
|
|
|
BESS charge capture price
|
|
|
|
|
Crucero
USD 61.3/MWh
|
|
Cardones
USD 68.4/MWh
|
|
Pan de Azúcar
USD 61.2/MWh
|
|
|
|
|
Polpaico
USD 116.7/MWh
|
|
Charrúa
USD 163.2/MWh
|
|
|
|
|
Energy weighted average spot price using BESS charge (both from co-located power plant and from grid) by zone
|
|
|
|
|
|
DNV, Magdalena 181, Las Condes, Santiago, Chile
|
|
|
|
|
|
|