|
|
VOL 12 | NUM 51 | 10 July 2026
|
|
|
|
|
|
|
|
CHILE | 29 June - 5 July 2026
|
|
|
|
Power Markets Weekly
is a brief weekly review of the electric market operation in Chile, Mexico, Iberia, France and Italy. If you are not a subscriber, please feel free to subscribe
here
|
|
|
|
|
|
DNV offers tools for Wholesale Market analysis and operation:
- DNV Power Analytics (DNV-PA) is our web-based platform that provides access to constantly updated long-term energy price forecasts.
- With a refined design and an improved user experience we are upgrading our digital services for our customers.
|
|
|
|
|
|
|
Argentine gas shortage and continuous dry weeks resulted in the highest prices registered since 2022
|
|
|
|
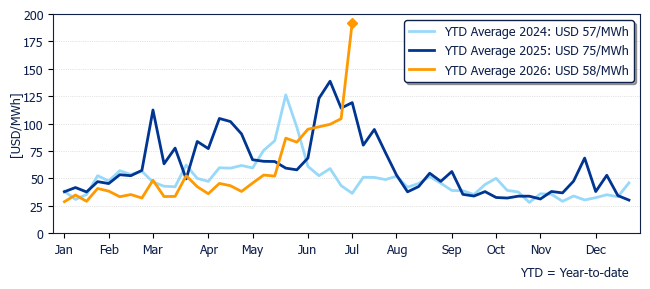
The average price in Polpaico was USD 192.2/MWh, 84% up from last week and 61% higher than the same week one year ago.
|
|
Marginal cost evolution in Polpaico during past years
|
|
|
|
|
|
|
This week, different factors combined to elevate marginal costs across all the SEN. From one side, hydro generation has seen a continuous decline as the drought continues to keep dam levels down, on the other side, gas power plants are being affected by a shortage in Argentinian gas supply, mainly in the Center area, which has led oil or more expensive units to operate. Finally, the Charrúa area saw low wind output from Thursday on.
|
|
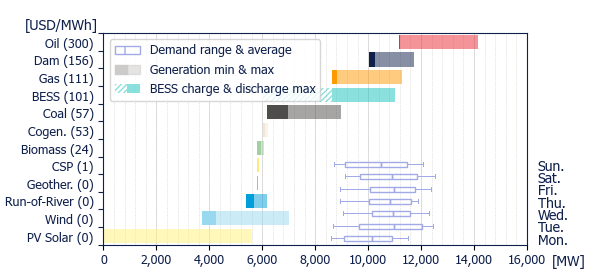
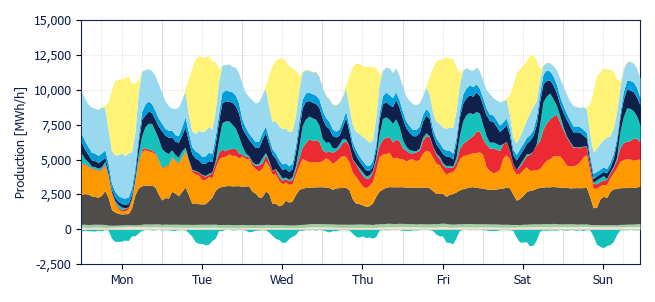
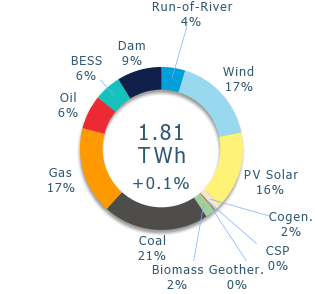
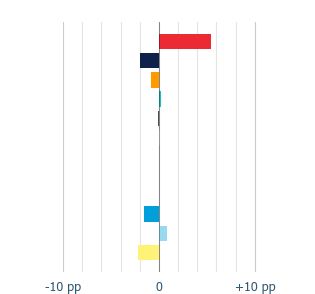
All of this led to a 5.5 pp increase in oil generation, representing 6% of the weekly mix, setting a record on Saturday at 10 PM, with 3.0 GW of output at that time. On the other hand, gas and coal decreased their participation, with a fall of 0.9 pp and 0.1 pp, respectively, as the Campiche coal-fired unit was unavailable from Tuesday onwards.
|
|
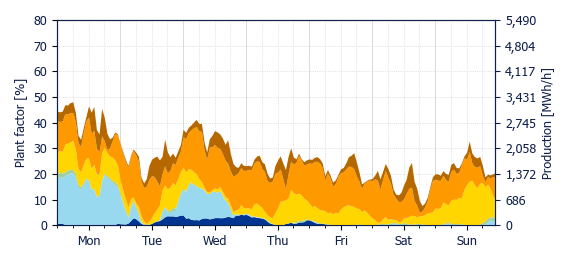
The drought was reflected by a decline in dam and run-of-river participation in the mix of 2.0 pp and 1.6 pp, respectively, while solar and wind presented a mixed behavior, while solar fell by 2.2 pp, wind output increased by 0.9 pp. However, wind generation gradually declined throughout the week, registering the lowest outputs on Friday and Saturday.
|
|
Generation peaked at 12.5 GW on Saturday at 3 PM, with solar and wind accounting for 42.9% of the total output at that hour.
|
|
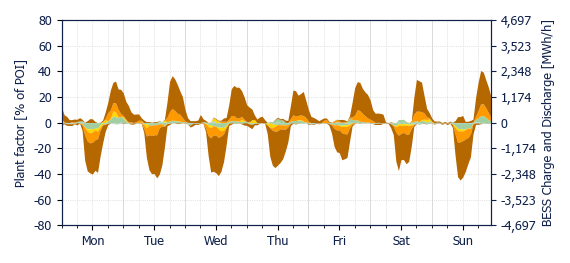
BESS participation in the system peaked at 7 PM on Sunday, accounting for 19.9% of the energy supply at that hour.
|
|
Generation Mix
|
|
|
|
|
Variation
|
|
|
|
|
Power range by energy sources (average prices)
|
|
|
|
|
|
|
|
|
|
|
|
|
|
Geothermal
|
|
Cogeneration
|
|
Biomass
|
|
Coal
|
|
|
Gas
|
|
Oil
|
|
BESS
|
|
Dam
|
|
|
Run-of-river
|
|
Wind
|
|
PV Solar
|
|
CSP
|
|
|
|
|
|
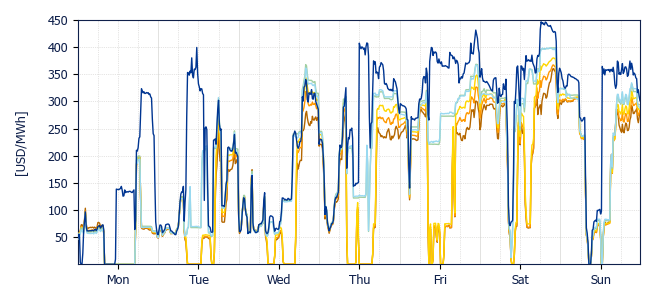
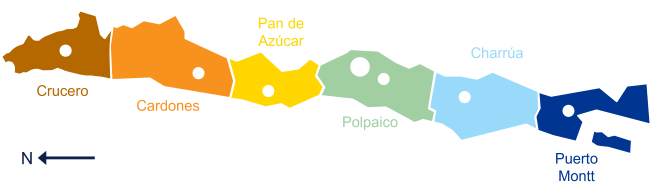
The average marginal cost rose above USD 130/MWh across all reference nodes in the system, driven by higher generation of oil-fired power plants from Wednesday onwards.
|
|
Congestion was registered every day of the week, with three events recorded on Tuesday, Thursday and Friday were the 500 kV Nueva Pan de Azúcar - Polpaico line, and the 220 kV Lastarria - Ciruelos congested simultaneously, resulting in three different price areas across the system.
|
|
The highest price across reference nodes was recorded on Saturday night hours, briefly rising above USD 350/MWh for all reference nodes, and near USD 450/MWh for Puerto Montt, in line with the record high oil generation.
|
|
|
|
|
|
|
Crucero
USD 139.9/MWh
|
|
Cardones
USD 147.0/MWh
|
|
Pan de Azúcar
USD 153.6/MWh
|
|
|
|
|
Polpaico
USD 192.2/MWh
|
|
Charrúa
USD 191.6/MWh
|
|
Puerto Montt
USD 240.2/MWh
|
|
|
|
|
|
Solar and Wind production & BESS dispatch
|
|
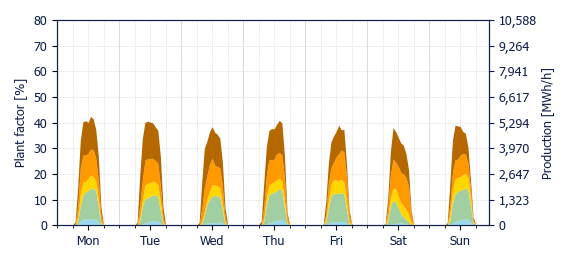
Solar output decreased by 12% | 39.5 GWh compared to last week. Regarding the plant factor, the highest was 15.4% in Cardones, while the lowest was 7.8% in Puerto Montt. The system-wide solar plant factor was 12.5%.
|
|
Wind generation increased this week by 5.0% | 16.1 GWh relative to last week. The highest plant factor was 45.0% in Crucero, while the lowest was 15.7% in Polpaico. The system-wide wind plant factor was 20.0%.
|
|
BESS showed an increase in injections of 5.0% | 4.8 GWh, mainly due to a 4.9 GWh increase in the Crucero area.
|
|
Curtailment rates reached 2.8% | 8.9 GWh for wind and 3.7% | 12.7 GWh for solar. This resulted in a combined system-wide curtailment rate of 3.3%, which represents a decrease of 0.2 pp relative to last week.
|
|
|
|
|
|
|
|
|
|
|
|
|
|
|
|
|
Crucero
USD 46.6/MWh
|
|
Cardones
USD 57.0/MWh
|
|
Pan de Azúcar
USD 58.1/MWh
|
|
|
|
|
Polpaico
USD 130.4/MWh
|
|
Charrúa
USD 125.9/MWh
|
|
Puerto Montt
USD 237.8/MWh
|
|
|
|
|
Energy weighted average spot price using PV production by zone
|
|
|
|
|
|
|
Crucero
USD 122.6/MWh
|
|
Cardones
USD 139.3/MWh
|
|
Pan de Azúcar
USD 152.8/MWh
|
|
|
|
|
Polpaico
USD 171.6/MWh
|
|
Charrúa
USD 74.9/MWh
|
|
Puerto Montt
USD 183.8/MWh
|
|
|
|
|
Energy weighted average spot price using wind production by zone
|
|
|
|
BESS discharge capture price
|
|
|
|
|
Crucero
USD 198.0/MWh
|
|
Cardones
USD 225.8/MWh
|
|
Pan de Azúcar
USD 134.0/MWh
|
|
|
|
|
Polpaico
USD 220.2/MWh
|
|
Charrúa
USD 195.9/MWh
|
|
|
|
|
Energy weighted average spot price using BESS discharge by zone
|
|
|
|
BESS charge capture price
|
|
|
|
|
Crucero
USD 51.1/MWh
|
|
Cardones
USD 51.8/MWh
|
|
Pan de Azúcar
USD 45.7/MWh
|
|
|
|
|
Polpaico
USD 123.6/MWh
|
|
Charrúa
USD 191.4/MWh
|
|
|
|
|
Energy weighted average spot price using BESS charge (both from co-located power plant and from grid) by zone
|
|
|
|
|
|
DNV, Magdalena 181, Las Condes, Santiago, Chile
|
|
|
|
|
|
|