|
|
VOL 12 | NUM 46 | 5 June 2026
|
|
|
|
Power Markets Weekly
is a brief weekly review of the electric market operation in Chile, Mexico, Iberia, France and Italy. If you are not a subscriber, please feel free to subscribe
here
|
|
|
|
|
|
DNV offers tools for Wholesale Market analysis and operation:
- DNV Power Analytics (DNV-PA) is our web-based platform that provides access to constantly updated long-term energy price forecasts.
- With a refined design and an improved user experience we are upgrading our digital services for our customers.
|
|
|
|
|
|
|
As winter begins to set, demand continues to grow along with prices
|
|
|
|
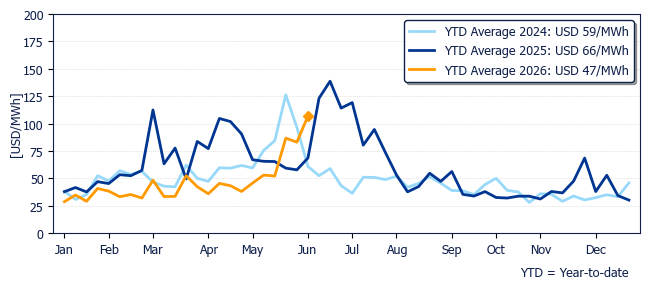
The average price in Polpaico was USD 106.8/MWh, 56% up from last week and 29% higher than the same week one year ago.
|
|
Marginal cost evolution in Polpaico during past years
|
|
|
|
|
|
|
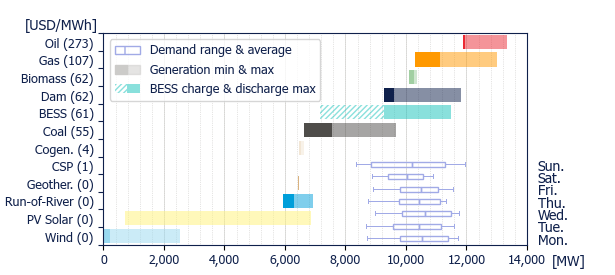
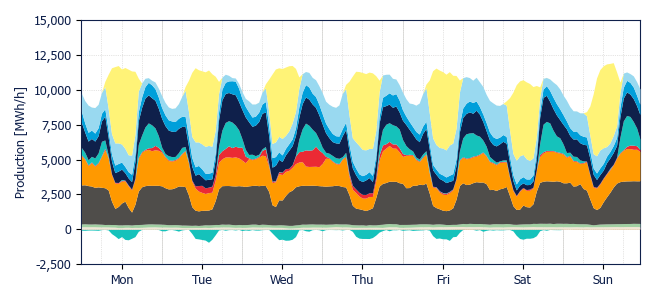
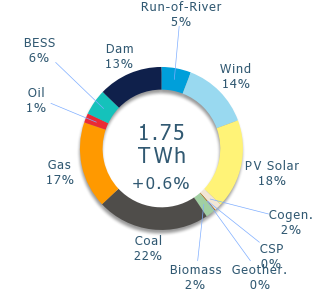
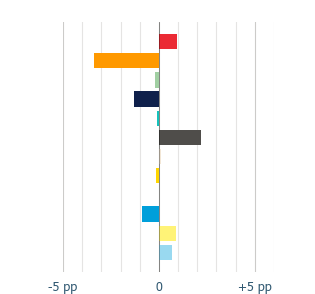
In this week's generation mix, thermals maintained their overall share, despite a gas decrease by 3.0 pp, mainly caused by an unexpected unavailability of the Atacama plant, which started on Tuesday and lasted until Thursday. This fall was leveled out by an increase in coal and diesel production by 2.3 pp and 0.9 pp, respectively.
|
|
Hydro generation registered a fall by 1.1 pp for dam, and 0.8 pp for run-of-river, conversely, solar and wind technologies increased in a similar magnitude, by 1.0 pp for solar and 0.8 pp for wind, balancing the fall in hydro.
|
|
Generation peaked on Sunday at 3 PM, with solar and wind accounting for 49.8% of the energy supply at that hour.
|
|
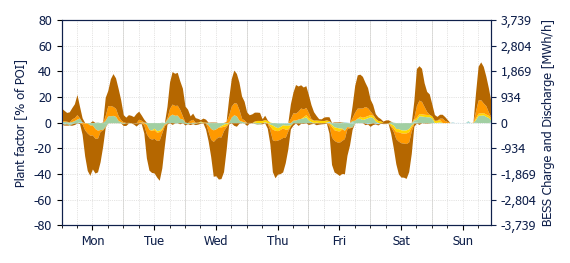
BESS participation share in the system peaked at 7 PM on Sunday, representing 19.6% of the total output at that hour.
|
|
Generation Mix
|
|
|
|
|
Variation
|
|
|
|
|
Power range by energy sources (average prices)
|
|
|
|
|
|
|
|
|
|
|
|
|
|
Geothermal
|
|
Cogeneration
|
|
Biomass
|
|
Coal
|
|
|
Gas
|
|
Oil
|
|
BESS
|
|
Dam
|
|
|
Run-of-river
|
|
Wind
|
|
PV Solar
|
|
CSP
|
|
|
|
|
|
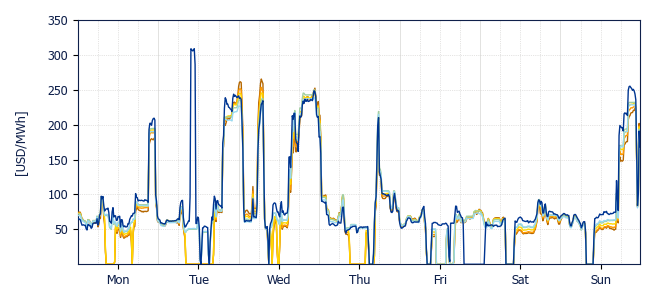
Congestion was recurrently present through the week, decoupling prices across the system every day except from Sunday. The main lines congested were:
|
- 500 kV Nueva Pan de Azúcar - Polpaico line congested on Monday, Tuesday, Wednesday and Thursday during solar hours.
- 220 kV Lastarria - Ciruelos line, which congested on Tuesday and Friday, decoupling Puerto Montt from the rest of the system. The Tuesday event led to three different prices across the system for a couple of hours, due to the 500 kV Nueva Pan de Azúcar - Polpaico line being already congested at that time.
- 220 kV Charrúa - Santa Clara line also congested for several hours, from Friday evening to Sunday early hours due to high wind output in the Charrúa area, decoupling Puerto Montt from the rest of the system, but this time, with prices in Puerto Montt dropping to zero.
|
|
The peak price of the week across reference nodes was USD 309/MWh, registered in Puerto Montt on Tuesday at 10:45 AM. Prices in the rest of the system peaked around USD 250/MWh on Tuesday 12 PM, due to the unavailability of the gas-fired Atacama plant and low wind output, oil-fired Olivos plant set the price at that time.
|
|
|
|
|
|
|
Crucero
USD 74.1/MWh
|
|
Cardones
USD 75.2/MWh
|
|
Pan de Azúcar
USD 76.5/MWh
|
|
|
|
|
Polpaico
USD 83.0/MWh
|
|
Charrúa
USD 81.4/MWh
|
|
Puerto Montt
USD 86.7/MWh
|
|
|
|
|
|
Solar and Wind production & BESS dispatch
|
|
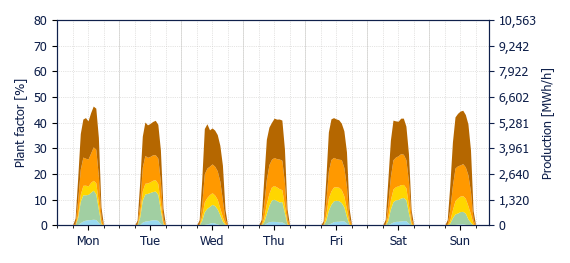
Solar output increased by 7.0% | 19.7 GWh compared to last week. Regarding the plant factor, the highest was 18.4% in Cardones, while the lowest was 7.0% in Puerto Montt. The system-wide solar plant factor was 13.9%.
|
|
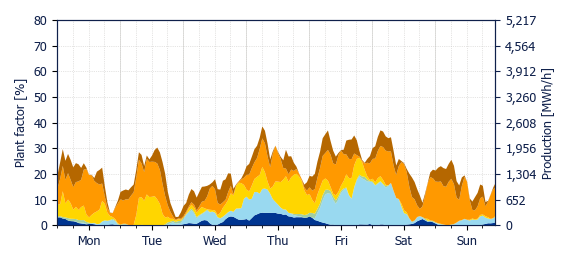
Wind generation also increased by 7.0% | 15.7 GWh relative to last week. The highest plant factor was 36.2% in Cardones, while the lowest was 13.1% in Pan de Azúcar. The system-wide wind plant factor was 21.6%.
|
|
BESS injections maintained the same level, with a minimal 314 MWh decrease in injections. Information on energy withdrawals on Sunday was not available, so it could not be displayed in the Hourly BESS production figure and also affects the BESS charge captured price.
|
|
This week, curtailment rates reached 4.6% | 11.4 GWh for wind and 6.48% | 24.5 GWh for solar. This resulted in a combined system-wide curtailment rate of 5.7%, which represents a decrease of 4.5 pp relative to last week.
|
|
|
|
|
|
|
|
|
|
|
|
|
|
|
|
|
Crucero
USD 31.7/MWh
|
|
Cardones
USD 31.3/MWh
|
|
Pan de Azúcar
USD 31.6/MWh
|
|
|
|
|
Polpaico
USD 46.5/MWh
|
|
Charrúa
USD 45.2/MWh
|
|
Puerto Montt
USD 63.2/MWh
|
|
|
|
|
Energy weighted average spot price using PV production by zone
|
|
|
|
|
|
|
Crucero
USD 66.8/MWh
|
|
Cardones
USD 54.0/MWh
|
|
Pan de Azúcar
USD 70.8/MWh
|
|
|
|
|
Polpaico
USD 77.3/MWh
|
|
Charrúa
USD 66.6/MWh
|
|
Puerto Montt
USD 90.5/MWh
|
|
|
|
|
Energy weighted average spot price using wind production by zone
|
|
|
|
BESS discharge capture price
|
|
|
|
|
Crucero
USD 119.0/MWh
|
|
Cardones
USD 126.7/MWh
|
|
Pan de Azúcar
USD 88.0/MWh
|
|
|
|
|
Polpaico
USD 125.6/MWh
|
|
Charrúa
USD 62.5/MWh
|
|
|
|
|
Energy weighted average spot price using BESS discharge by zone
|
|
|
|
BESS charge capture price
|
|
|
|
|
Crucero
USD 30.5/MWh
|
|
Cardones
USD 25.1/MWh
|
|
Pan de Azúcar
USD 30.1/MWh
|
|
|
|
|
Polpaico
USD 51.7/MWh
|
|
Charrúa
USD 57.0/MWh
|
|
|
|
|
Energy weighted average spot price using BESS charge (both from co-located power plant and from grid) by zone
|
|
|
|
|
|
DNV, Magdalena 181, Las Condes, Santiago, Chile
|
|
|
|
|
|
|