|
|
VOL 12 | NUM 3 | 8 August 2025
|
|
|
|
|
|
|
|
CHILE | 28 July - 3 August 2025
|
|
|
|
Power Markets Weekly
is a brief weekly review of the electric market operation in Chile, Mexico, Iberia, France and Italy. If you are not a subscriber, please feel free to subscribe
here
|
|
|
|
|
|
DNV offers tools for Wholesale Market analysis and operation:
- DNV Power Analytics (DNV-PA) is our web-based platform that provides access to constantly updated long-term energy price forecasts.
- With a refined design and an improved user experience we are upgrading our digital services for our customers.
|
|
|
|
|
|
|
Wind displaces thermal generation amid strong resource week
|
|
|
|
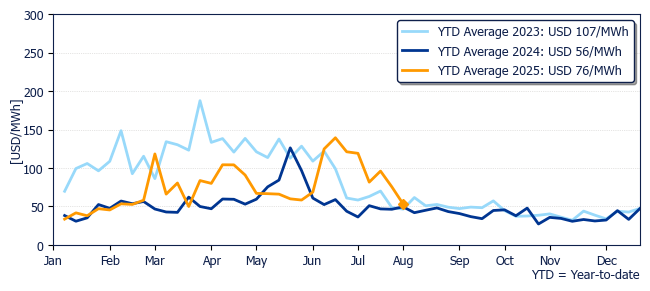
The average price in Polpaico was USD 53.3/MWh, a 29% decrease from the previous week, though still 8% higher than the same week 1 year ago.
|
|
Marginal cost evolution in Polpaico during past years
|
|
|
|
|
|
|
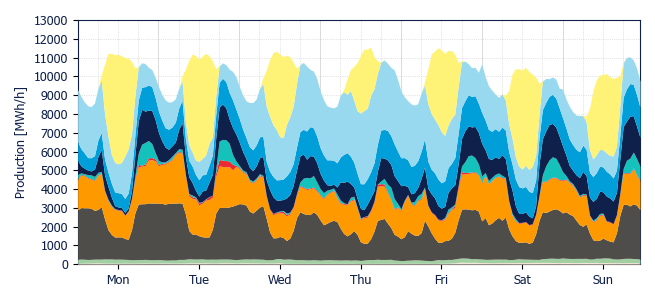
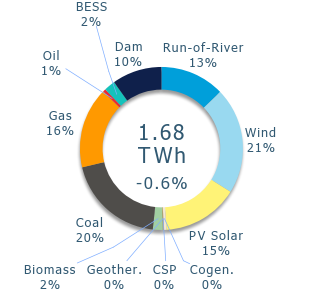
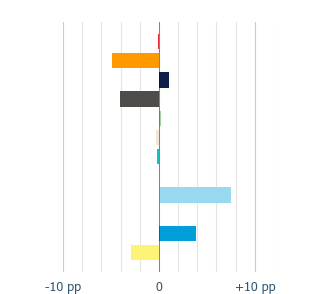
Generation mix saw significant changes:
|
- Wind generation soared, increasing its share by 7.5 pp. with a boost of +124 GWh.
- Gas and coal generation fell sharply, by 4.8 pp. and 4.0 pp., respectively.
- Solar output declined by 3.0 pp. due to a less sunny week.
- Run-of-river and dam generation increased by 3.9 pp. and 1.0 pp. respectively, supported by favorable hydrological conditions.
|
|
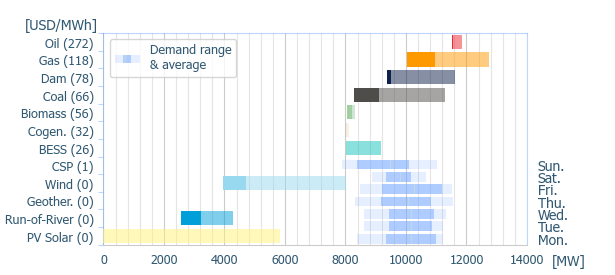
The variable cost of dam stored energy decreased to USD 77.9/MWh.
|
|
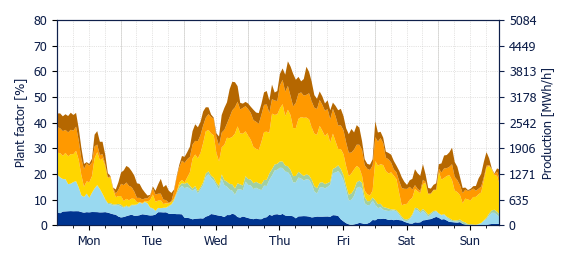
The weekly demand peak occurred on Thursday at 4 PM, reaching 11.6 GW. Notably, wind and solar contributed 57.4% of the generation mix at that hour.
|
|
Generation Mix
|
|
|
|
|
Variation
|
|
|
|
|
Power range by energy sources (average prices)
|
|
|
|
|
|
|
|
|
|
|
|
|
|
Geothermal
|
|
Cogeneration
|
|
Biomass
|
|
Coal
|
|
|
Gas
|
|
Oil
|
|
BESS
|
|
Dam
|
|
|
Run-of-river
|
|
Wind
|
|
PV Solar
|
|
CSP
|
|
|
|
|
|
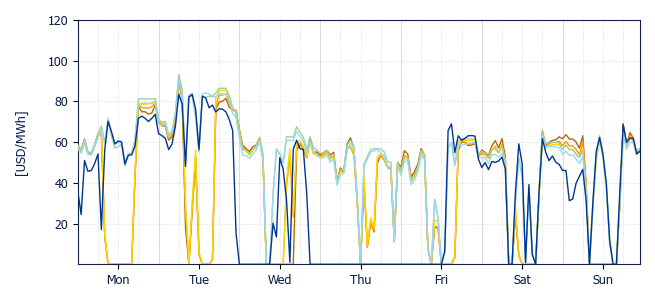
Transmission constraints continued to decouple zones:
|
- Puerto Montt zone was decoupled from the rest of the system Monday to Friday, as wind output congested the 220 kV Charrúa – Santa Clara line, leading to curtailment of wind energy.
- Northern zones (Pan de Azúcar and northward) faced congestion in the 500 kV Nueva Pan de Azúcar – Polpaico line, particularly at the beginning of the week, limiting the transfer of solar and wind energy to central areas.
|
|
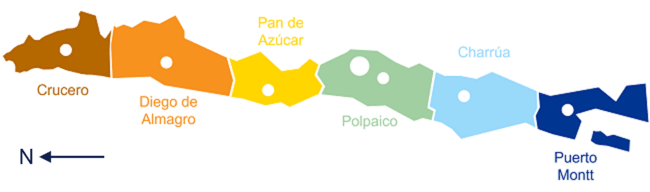
The highest number of zero-price hours occurred in Puerto Montt zone: 56, followed by northern zones: Crucero 43, Diego de Almagro 40, Pan de Azúcar 34 and Polpaico and Charrúa 11.
|
|
The highest marginal cost was recorded on Tuesday, 29 July at 6 AM in Polpaico, reaching USD 93.2/MWh, with several gas units setting the price and low wind generation.
|
|
|
|
|
|
|
Crucero
USD 39.8/MWh
|
|
D. de Almagro
USD 40.2/MWh
|
|
Pan de Azúcar
USD 41.9/MWh
|
|
|
|
|
Polpaico
USD 53.3/MWh
|
|
Charrúa
USD 52.0/MWh
|
|
Puerto Montt
USD 35.4/MWh
|
|
|
|
|
|
Solar and Wind production & BESS dispatch
|
|
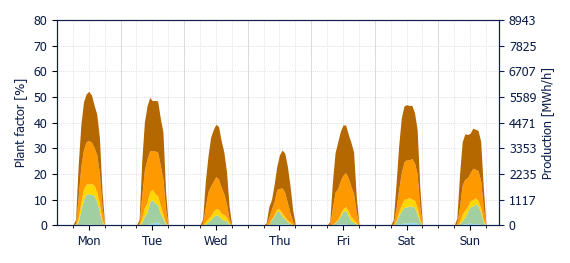
Solar generation exhibited a system average plant factor of 13.5% this week. The highest solar performance was observed in the Crucero zone, where the plant factor reached 18.8%, while the lowest occurred in Puerto Montt, with only 5.8%, reflecting the less favorable irradiance of the area.
|
|
Wind generation increased substantially across the country, with all zones showing improved output. The average wind plant factor reached 33.3%, with Puerto Montt achieving the highest value at 52.4%, and Crucero registering the lowest at 21.9%. The Pan de Azúcar zone experienced the most notable increase, with an additional 72.5 GWh of wind energy generated compared to the previous week.
|
|
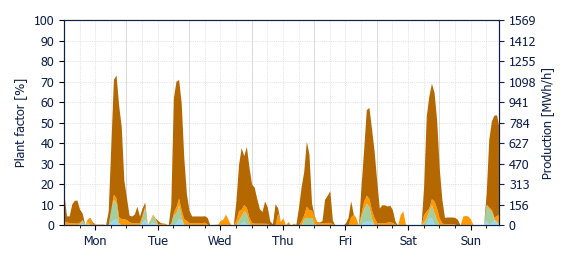
BESS showed a decline in total injections by approximately 11% (equivalent to –4.4 GWh), primarily due to the lower availability of solar generation for charging. The BESS discharge capture prices varied by zone and were between USD 68.8/MWh and USD 44.7/MWh.
|
|
Curtailment levels increased this week. Wind curtailment rate reached 5.9%, while solar curtailment was significantly higher at 12.3%. The combined weighted average solar and wind curtailment reached 9.7%, a noticeable increase from 6.8% the previous week.
|
|
|
|
|
|
|
|
|
|
|
|
|
|
|
|
|
Crucero
USD 8.1/MWh
|
|
D. de Almagro
USD 9.0/MWh
|
|
Pan de Azúcar
USD 13.0/MWh
|
|
|
|
|
Polpaico
USD 45.7/MWh
|
|
Charrúa
USD 41.4/MWh
|
|
Puerto Montt
USD 30.8/MWh
|
|
|
|
|
Energy weighted average spot price using PV production by zone
|
|
|
|
|
|
|
Crucero
USD 39.9/MWh
|
|
D. de Almagro
USD 40.1/MWh
|
|
Pan de Azúcar
USD 41.3/MWh
|
|
|
|
|
Polpaico
USD 50.0/MWh
|
|
Charrúa
USD 49.5/MWh
|
|
Puerto Montt
USD 37.0/MWh
|
|
|
|
|
Energy weighted average spot price using wind production by zone
|
|
|
|
BESS discharge capture price
|
|
|
|
|
Crucero
USD 62.2/MWh
|
|
D. de Almagro
USD 44.7/MWh
|
|
Pan de Azúcar
USD 60.7/MWh
|
|
|
|
|
Polpaico
USD 67.1/MWh
|
|
Charrúa
USD 68.8/MWh
|
|
|
|
|
Energy weighted average spot price using BESS injection by zone
|
|
|
|
|
|
DNV, Magdalena 181, Las Condes, Santiago, Chile
|
|
|
|
|
|
|