|
|
VOL 12 | NUM 24 | 5 January 2026
|
|
|
|
|
|
|
|
CHILE | 22 - 28 December 2025
|
|
|
|
Power Markets Weekly
is a brief weekly review of the electric market operation in Chile, Mexico, Iberia, France and Italy. If you are not a subscriber, please feel free to subscribe
here
|
|
|
|
|
|
DNV offers tools for Wholesale Market analysis and operation:
- DNV Power Analytics (DNV-PA) is our web-based platform that provides access to constantly updated long-term energy price forecasts.
- With a refined design and an improved user experience we are upgrading our digital services for our customers.
|
|
|
|
|
|
|
And… we are back! We hope you had the best end of year, and we wish you the best in this 2026. As always, every Friday we will continue to give you the best insights of the weekly SEN operation
|
|
Christmas gave us the present of a new solar generation record: 8,916 MW at 12 PM of Friday!
|
|
|
|
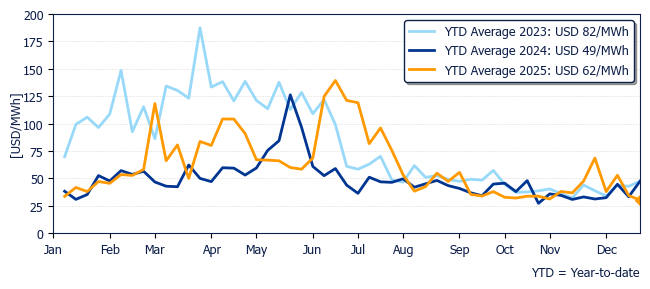
The average price in Polpaico was USD 30.2/MWh, showing a 12% decrease compared to last week and 36% compared to the same week last year.
|
|
Marginal cost evolution in Polpaico during past years
|
|
|
|
|
|
|
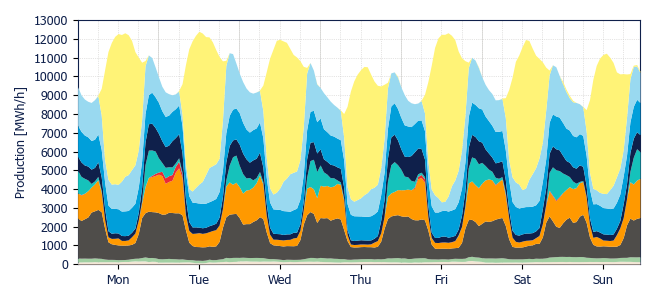
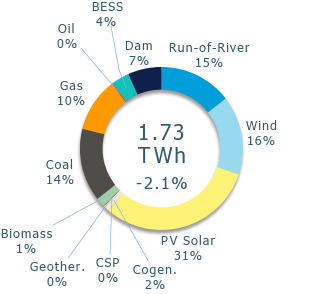
Total demand in the system dropped by 2.1% given the Christmas holiday.
|
|
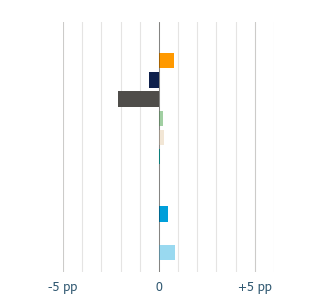
A mirror effect was observed on the share of hydro sources in the generation mix: run-of river increased its share by 0.5 pp, while dam saw an equivalent 0.5 pp decrease.
|
|
A new record for solar generation was set at 12 PM on Friday, when injections reached 8,916 MWh/h. However, its total share for the week remained unchanged compared with the previous week. BESS increased slightly by 0.1 pp, while the largest variation came from wind, which rose by 0.8 pp.
|
|
The increase in wind generation, combined with the reduction in demand, likely explains the 2.1 pp drop in the share of coal. On the other hand, gas increased its share by 0.8 pp and oil saw no changes.
|
|
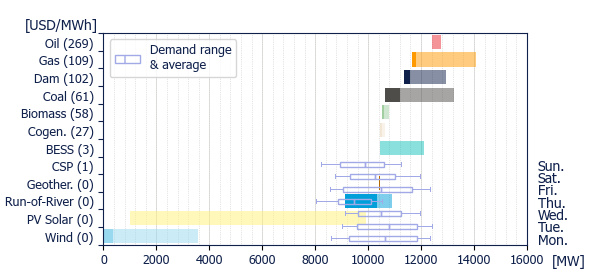
Peak demand was 12.4 GW at 12 PM on Tuesday, when solar and wind accounted for 73.7% of the generation. In terms of BESS participation, its peak was at 10 PM on Sunday with 15.7%.
|
|
Generation Mix
|
|
|
|
|
Variation
|
|
|
|
|
Power range by energy sources (average prices)
|
|
|
|
|
|
|
|
|
|
|
|
|
|
Geothermal
|
|
Cogeneration
|
|
Biomass
|
|
Coal
|
|
|
Gas
|
|
Oil
|
|
BESS
|
|
Dam
|
|
|
Run-of-river
|
|
Wind
|
|
PV Solar
|
|
CSP
|
|
|
|
|
|
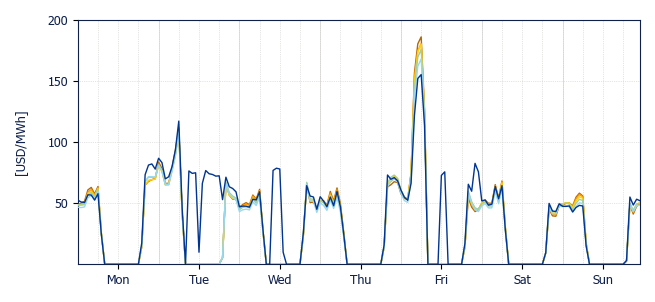
The system was overall coupled throughout the week, with exceptional price decoupling in Puerto Montt due to congestion on the 220 kV Lastarria–Ciruelos line on Tuesday, Wednesday, and Friday during solar hours. On this last day, there was also congestion during nighttime hours.
|
|
At 6 AM on Friday, the system recorded its peak marginal costs, ranging from USD 186.2/MWh in Crucero to USD 155.3/MWh in Puerto Montt, with Los Pinos (oil) setting the price.
|
|
Zero price hours totaled 77 from Crucero to Charrúa, while Puerto Montt presented only 61.
|
|
|
|
|
|
|
Crucero
USD 30.6/MWh
|
|
D. de Almagro
USD 30.4/MWh
|
|
Pan de Azúcar
USD 30.3/MWh
|
|
|
|
|
Polpaico
USD 30.2/MWh
|
|
Charrúa
USD 29.2/MWh
|
|
Puerto Montt
USD 37.6/MWh
|
|
|
|
|
|
Solar and Wind production & BESS dispatch
|
|
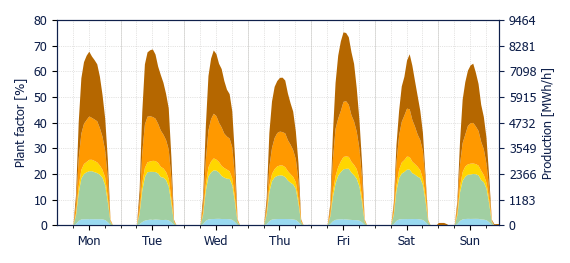
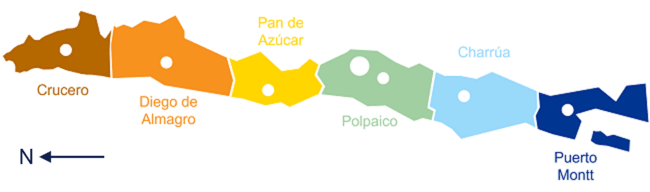
Solar generation decreased this week by 11.7 GWh (-2.1%). The higher plant factor was seen in Charrúa area (36.9%), while the lowest was in Pan de Azúcar with 25.0%. Crucero and Cardones were similar, both with 25.5%. The system wide solar plant factor was of 27.1%.
|
|
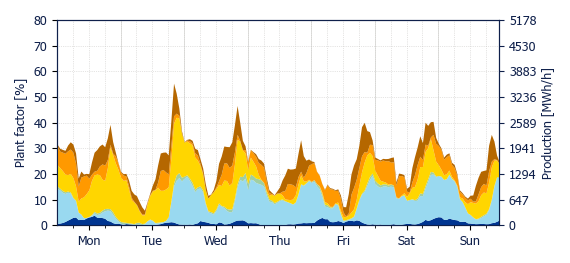
On the other hand, wind generation increased this week by 8.8 GWh (+3.4%). The higher plant factor was seen in Charrúa area (also 36.9%), while the lowest was in Polpaico with 18.0%. The system wide wind plant factor was of 24.8%.
|
|
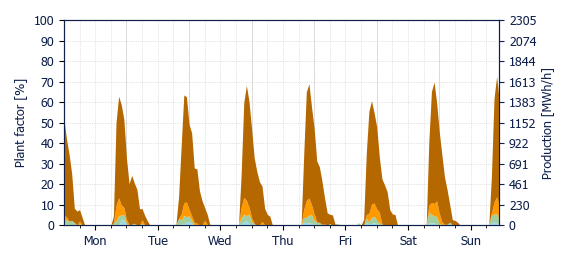
BESS injections increased by 1.6 MWh, showing almost no variation compared to last week. The area that showed the main increase in BESS injections was Polpaico with an additional 509 MWh, while Crucero had the major decrease with a drop of 435 MWh.
|
|
This week’s curtailment rate was 18.6% for wind (61.8 MWh curtailed) and 25.0% for solar (168.2 MWh curtailed), reaching a compound average curtailment rate of 22.3%, 4.5 pp higher than last week's rate of 17.8%.
|
|
|
|
|
|
|
|
|
|
|
|
|
|
|
|
|
Crucero
USD 1.1/MWh
|
|
D. de Almagro
USD 1.4/MWh
|
|
Pan de Azúcar
USD 1.4/MWh
|
|
|
|
|
Polpaico
USD 1.7/MWh
|
|
Charrúa
USD 2.2/MWh
|
|
Puerto Montt
USD 14.7/MWh
|
|
|
|
|
Energy weighted average spot price using PV production by zone
|
|
|
|
|
|
|
Crucero
USD 22.2/MWh
|
|
D. de Almagro
USD 31.7/MWh
|
|
Pan de Azúcar
USD 32.0/MWh
|
|
|
|
|
Polpaico
USD 41.7/MWh
|
|
Charrúa
USD 37.0/MWh
|
|
Puerto Montt
USD 36.6/MWh
|
|
|
|
|
Energy weighted average spot price using wind production by zone
|
|
|
|
BESS discharge capture price
|
|
|
|
|
Crucero
USD 55.5/MWh
|
|
D. de Almagro
USD 55.1/MWh
|
|
Pan de Azúcar
USD 59.5/MWh
|
|
|
|
|
Polpaico
USD 54.6/MWh
|
|
Charrúa
USD 54.1/MWh
|
|
|
|
|
Energy weighted average spot price using BESS injection by zone
|
|
|
|
|
|
DNV, Magdalena 181, Las Condes, Santiago, Chile
|
|
|
|
|
|
|