|
|
VOL 12 | NUM 21 | 12 December 2025
|
|
|
|
|
|
|
|
CHILE | 1 - 7 December 2025
|
|
|
|
Power Markets Weekly
is a brief weekly review of the electric market operation in Chile, Mexico, Iberia, France and Italy. If you are not a subscriber, please feel free to subscribe
here
|
|
|
|
|
|
DNV offers tools for Wholesale Market analysis and operation:
- DNV Power Analytics (DNV-PA) is our web-based platform that provides access to constantly updated long-term energy price forecasts.
- With a refined design and an improved user experience we are upgrading our digital services for our customers.
|
|
|
|
|
|
|
Yesterday, Enel Generación was awarded 3,360 GWh of energy in the latest regulated tender organized by the National Energy Commission (tender 2025/01). If you would like to know more about the tender and its results, please follow those two links to DNV analysis:
|
|
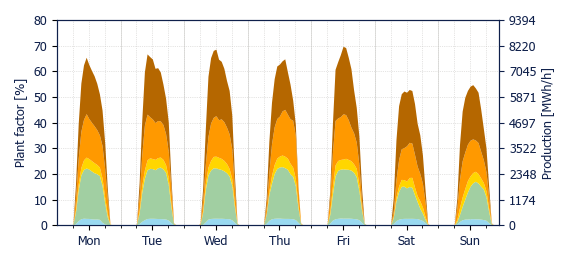
Brightest moment yet: solar generation reaches record injections of 8,229 MW in a single hour at 12 PM on Friday.
|
|
|
|
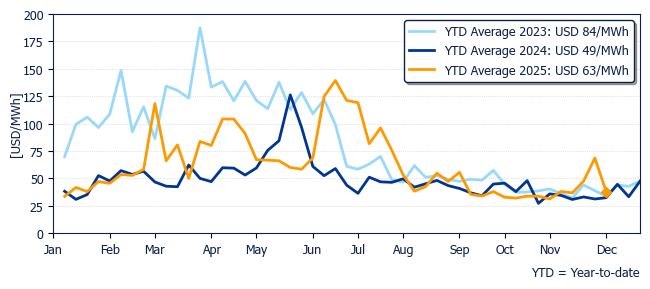
The average price in Polpaico reached USD 37.9/MWh, showing a decrease of 45% compared to last week, but 17% higher than the same week last year.
|
|
Marginal cost evolution in Polpaico during past years
|
|
|
|
|
|
|
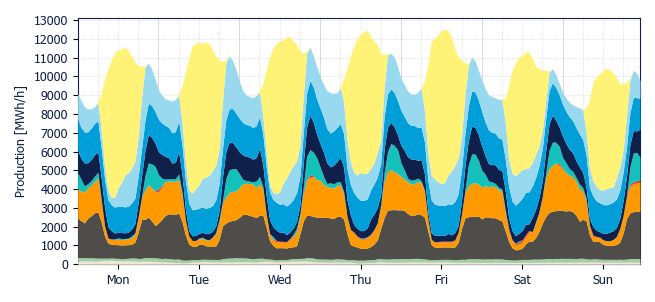
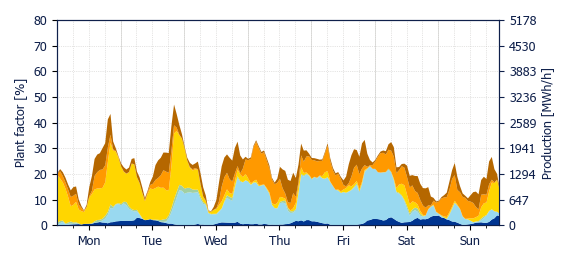
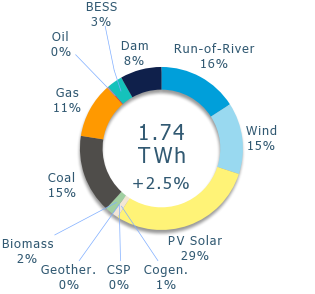
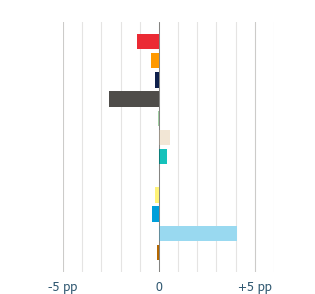
In terms of the generation mix, a recovery on wind participation was seen this week, with an increase of 4.0 pp in its share, reaching a total participation of 14.2% of the weekly generation mix. The only other increases in share were BESS by 0.4 pp and cogeneration by 0.6 pp.
|
|
Other technologies reduced their shares, especially thermal sources: coal, oil and gas showed a reduction of 2.6 pp, 1.1 pp and 0.4 pp, respectively. Hydro sources and solar were also slightly reduced: run-of-river by 0.4 pp, dam by 0.2 pp and solar by 0.1 pp.
|
|
Even with a diminished share on the mix, solar injections reached 8,229 MWh/h at 12 PM on Friday, which is the highest hourly injections for the technology ever. At the time, solar generation accounted for 65.7% of the generation mix.
|
|
The hourly peak demand of the week was of 12.5 GWh/h and was registered at 1 PM on Friday, when solar and wind accounted for 75.1% of the energy supply.
|
|
Generation Mix
|
|
|
|
|
Variation
|
|
|
|
|
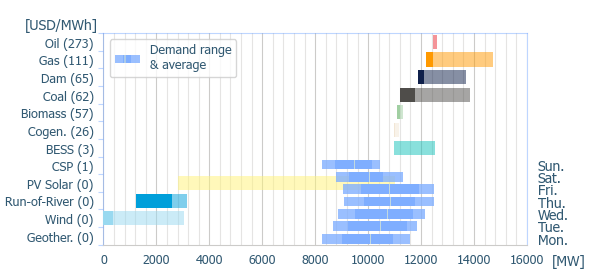
Power range by energy sources (average prices)
|
|
|
|
|
|
|
|
|
|
|
|
|
|
Geothermal
|
|
Cogeneration
|
|
Biomass
|
|
Coal
|
|
|
Gas
|
|
Oil
|
|
BESS
|
|
Dam
|
|
|
Run-of-river
|
|
Wind
|
|
PV Solar
|
|
CSP
|
|
|
|
|
|
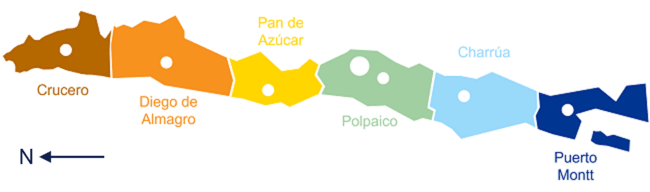
An overall coupled system was seen from Charrúa to the north, except in Crucero area that was affected by a programmed line maitenance. The main line congestions were as follows:
|
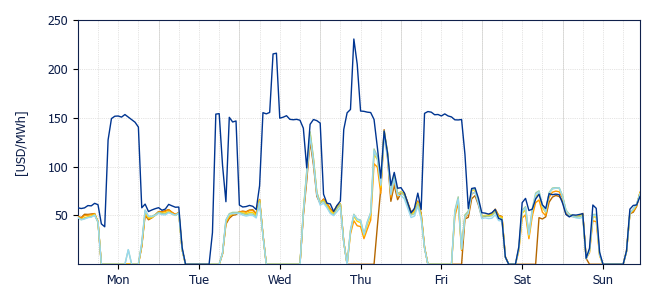
- 220 kV Lastarria – Ciruelos line, aside from Sunday, presented congestion through the whole week, mostly in solar hours, but also at night times. This caused the decoupling of Puerto Montt, which was forced to operate with oil power plants to meet the demand, hence registering the peak price of the week of USD 230.5/MWh at 10 AM on Thursday, set by Trapen power plant (oil).
- Due to a programmed maintenance, the first circuit of the 500 kV line Cumbre – Nueva Cardones was out of service (from 4 December to 12 December). This led to an operation with only one circuit, which limited the flow, and so, decoupled the system north of Cardones during solar hours.
- Between 3 PM and 6 PM on Monday, 500 kV Nueva Pan de Azúcar – Polpaico line was congested, decoupling the system between Pan de Azúcar and Polpaico.
|
|
In total, Crucero presented 74 hours with marginal costs of USD 0/MWh, Cardones and Pan de Azúcar 53, Polpaico and Charrúa 52, and finally Puerto Montt only 18.
|
|
|
|
|
|
|
Crucero
USD 30.8/MWh
|
|
D. de Almagro
USD 36.7/MWh
|
|
Pan de Azúcar
USD 37.5/MWh
|
|
|
|
|
Polpaico
USD 37.9/MWh
|
|
Charrúa
USD 37.0/MWh
|
|
Puerto Montt
USD 84.4/MWh
|
|
|
|
|
|
Solar and Wind production & BESS dispatch
|
|
Solar generation totalled 505.9 GWh this week, the highest weekly plant factor was seen in Charrúa with 36.1%, while the lowest was at Pan de Azúcar area with 23.2%. The system wide plant factor was of 25.5%.
|
|
Wind generation saw an improvement compared to the previous weeks. The total generation reached 246.3 GWh, an increase of 43.8% compared to last week. The highest weekly plant factor was seen in Charrúa area with 32.9%, while the lowest was at Polpaico area with 13.8%. The system wide plant factor was of 22.7%.
|
|
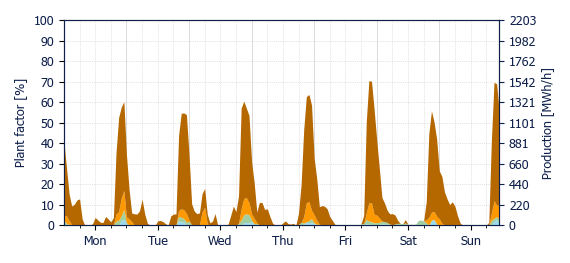
In terms of BESS injections, they reached 54.5 GWh, the area that had the biggest increase (+21.7%) was Crucero area, reaching a total injection of 46.8 GWh.
|
|
The curtailment rates of the week were 16.0% for wind (-7.8 GWh | -2.6 pp, compared to last week), and 21.4% for solar (-16.0 GWh | +1.7 pp, compared to last week), reaching a system wide curtailment rate of 19.2% (similar to last week’s rate of 18.8%).
|
|
|
|
|
|
|
|
|
|
|
|
|
|
|
|
|
Crucero
USD 2.2/MWh
|
|
D. de Almagro
USD 16.7/MWh
|
|
Pan de Azúcar
USD 17.1/MWh
|
|
|
|
|
Polpaico
USD 16.2/MWh
|
|
Charrúa
USD 18.9/MWh
|
|
Puerto Montt
USD 88.9/MWh
|
|
|
|
|
Energy weighted average spot price using PV production by zone
|
|
|
|
|
|
|
Crucero
USD 25.7/MWh
|
|
D. de Almagro
USD 36.3/MWh
|
|
Pan de Azúcar
USD 32.8/MWh
|
|
|
|
|
Polpaico
USD 40.8/MWh
|
|
Charrúa
USD 46.0/MWh
|
|
Puerto Montt
USD 66.7/MWh
|
|
|
|
|
Energy weighted average spot price using wind production by zone
|
|
|
|
BESS discharge capture price
|
|
|
|
|
Crucero
USD 59.8/MWh
|
|
D. de Almagro
USD 67.1/MWh
|
|
Pan de Azúcar
USD 67.7/MWh
|
|
|
|
|
Polpaico
USD 63.0/MWh
|
|
Charrúa
USD 64.5/MWh
|
|
|
|
|
Energy weighted average spot price using BESS injection by zone
|
|
|
|
|
|
DNV, Magdalena 181, Las Condes, Santiago, Chile
|
|
|
|
|
|
|