|
|
VOL 12 | NUM 18 | 21 November 2025
|
|
|
|
|
|
|
|
CHILE | 10 - 16 November 2025
|
|
|
|
Power Markets Weekly
is a brief weekly review of the electric market operation in Chile, Mexico, Iberia, France and Italy. If you are not a subscriber, please feel free to subscribe
here
|
|
|
|
|
|
DNV offers tools for Wholesale Market analysis and operation:
- DNV Power Analytics (DNV-PA) is our web-based platform that provides access to constantly updated long-term energy price forecasts.
- With a refined design and an improved user experience we are upgrading our digital services for our customers.
|
|
|
|
|
|
|
Oil dispatch for inertia amid high renewables
|
|
|
|
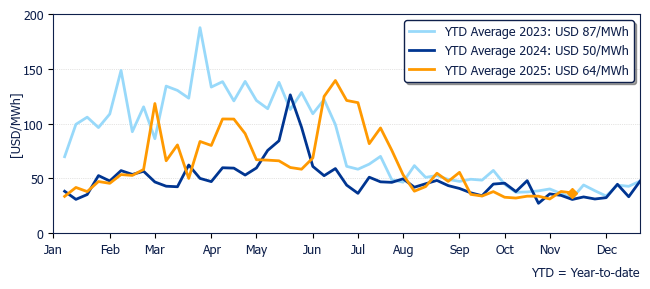
The average price at Polpaico was USD 36.7/MWh, 3% lower than last week and 19% higher than the same week last year.
|
|
Marginal cost evolution in Polpaico during past years
|
|
|
|
|
|
|
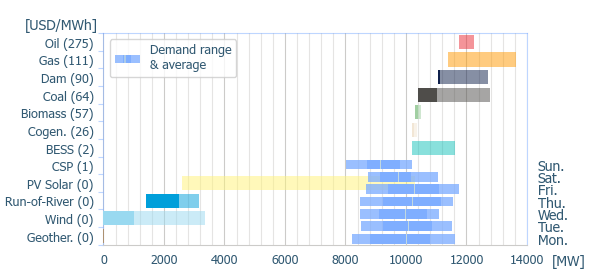
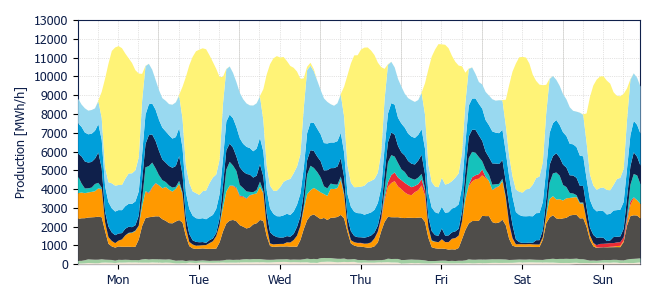
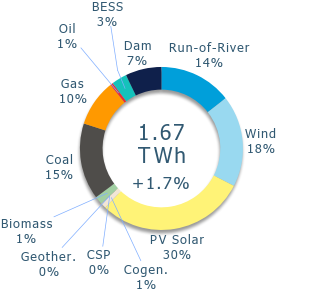
Weekly energy demand rose by 1.7% compared to the previous week, totaling 1.67 TWh. The maximum demand of the system reached 11.7 GW on Friday at 11 AM, with wind, solar, and BESS contributing 76.8% of the output. The highest wind-solar-BESS participation occurred on Tuesday at 2 PM, covering 78.9% of the 11.5 GW demand.
|
|
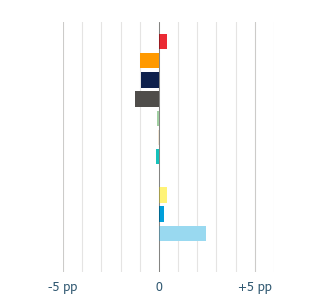
Renewables increased their share in the generation mix by 2.2 pp, driven mainly by wind, which rose by 2.4 pp. Solar and run-of-river also increased their shares by 0.4 pp and 0.2 pp, respectively, while dam reduced its share by 0.9 pp.
|
|
Among fossil fuels, oil increased its share by 0.4 pp, while coal and gas decreased theirs by 1.3 pp and 1.0 pp, respectively.
|
|
Generation Mix
|
|
|
|
|
Variation
|
|
|
|
|
Power range by energy sources (average prices)
|
|
|
|
|
|
|
|
|
|
|
|
|
|
Geothermal
|
|
Cogeneration
|
|
Biomass
|
|
Coal
|
|
|
Gas
|
|
Oil
|
|
BESS
|
|
Dam
|
|
|
Run-of-river
|
|
Wind
|
|
PV Solar
|
|
CSP
|
|
|
|
|
|
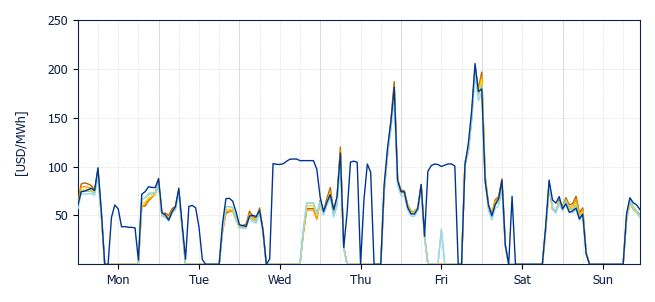
Regarding price profiles among reference nodes, Monday and Tuesday showed coupled prices from Charrúa to the northern nodes, while Puerto Montt intermittently decoupled during solar hours without reaching peak levels. On Wednesday, however, Puerto Montt experienced prolonged decoupling during solar hours, sustaining prices near the peaks observed earlier in the week.
|
|
Thursday and Friday brought systemic price spikes, an effect that persisted into early Saturday before returning to normal patterns.
|
|
The Wednesday decoupling was driven by high renewable availability from Charrúa northward during solar hours, which could not be exported to Puerto Montt due to congestion on the 220 kV Lastarria - Ciruelos line. During this period, the Canutillar plant set the price in Puerto Montt close to USD 100/MWh.
|
|
System-wide price spikes on Thursday and Friday were caused by diesel dispatch to meet demand, pushing prices above scheduled levels. The weekly peak price among reference nodes reached USD 220.4/MWh on Friday at 10 PM in Puerto Montt, with the Los Espinos oil plant setting the marginal cost.
|
|
This week also saw notable oil generation on Sunday, although it did not impact price levels. The reason was the technical (non-economic) dispatch of the Kelar oil plant in the Crucero zone, operated to provide inertia to the system during periods of high inverter-based renewable penetration. This requirement was outlined in CEN’s DAOP Minute N°04/2025.
|
|
|
|
|
|
|
Crucero
USD 37.4/MWh
|
|
D. de Almagro
USD 36.6/MWh
|
|
Pan de Azúcar
USD 36.4/MWh
|
|
|
|
|
Polpaico
USD 36.7/MWh
|
|
Charrúa
USD 35.6/MWh
|
|
Puerto Montt
USD 58.0/MWh
|
|
|
|
|
|
Solar and Wind production & BESS dispatch
|
|
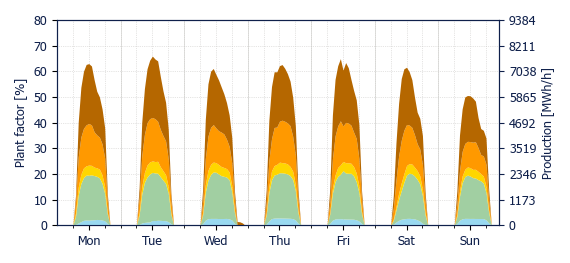
Solar generation increased by 14.9 GWh (+3.1%), with a system-wide plant factor of 25.0%. The highest solar plant factor was observed in the Charrúa zone (32.7%), while the lowest was in the Pan de Azúcar zone (22.5%).
|
|
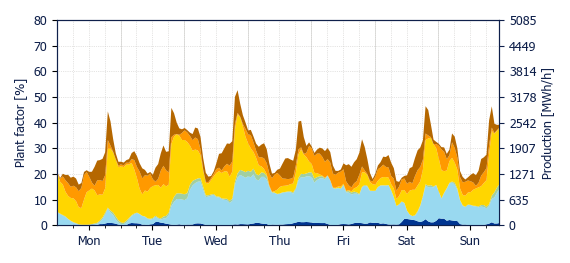
Wind generation rose by 45.0 GWh (+17.5%). The system plant factor was 28.3%, with Charrúa leading at 40.4% and Puerto Montt recording the lowest at 13.9%. Wind output in Charrúa was particularly strong on Thursday, with a plant factor of 63.9%.
|
|
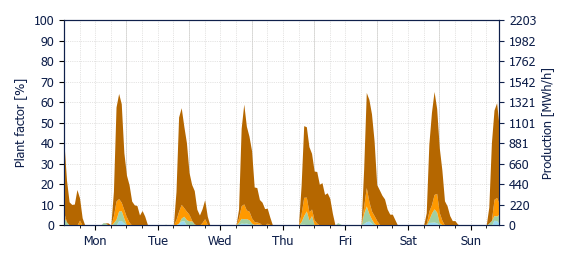
BESS discharge totaled 50.7 GWh, down by 1.9 GWh (-3.6%) from the previous week. The Charrúa zone recorded the steepest decline, with injection dropping 10.6% (-95 MWh).
|
|
Solar curtailment reached 24.4%, up by 4.5 pp from the previous week. Wind curtailment was 20.1%, up by 3.6 pp. The combined curtailment rate was 20.0%, 3.9 pp higher than last week.
|
|
|
|
|
|
|
|
|
|
|
|
|
|
|
|
|
Crucero
USD 1.6/MWh
|
|
D. de Almagro
USD 2.4/MWh
|
|
Pan de Azúcar
USD 2.0/MWh
|
|
|
|
|
Polpaico
USD 2.5/MWh
|
|
Charrúa
USD 2.8/MWh
|
|
Puerto Montt
USD 45.6/MWh
|
|
|
|
|
Energy weighted average spot price using PV production by zone
|
|
|
|
|
|
|
Crucero
USD 33.9/MWh
|
|
D. de Almagro
USD 29.7/MWh
|
|
Pan de Azúcar
USD 40.5/MWh
|
|
|
|
|
Polpaico
USD 47.6/MWh
|
|
Charrúa
USD 43.7/MWh
|
|
Puerto Montt
USD 54.1/MWh
|
|
|
|
|
Energy weighted average spot price using wind production by zone
|
|
|
|
BESS discharge capture price
|
|
|
|
|
Crucero
USD 76.3/MWh
|
|
D. de Almagro
USD 78.4/MWh
|
|
Pan de Azúcar
USD 79.4/MWh
|
|
|
|
|
Polpaico
USD 77.8/MWh
|
|
Charrúa
USD 75.2/MWh
|
|
|
|
|
Energy weighted average spot price using BESS injection by zone
|
|
|
|
|
|
DNV, Magdalena 181, Las Condes, Santiago, Chile
|
|
|
|
|
|
|