|
|
VOL 12 | NUM 12 | 10 October 2025
|
|
|
|
|
|
|
|
CHILE | 29 September - 5 October 2025
|
|
|
|
Power Markets Weekly
is a brief weekly review of the electric market operation in Chile, Mexico, Iberia, France and Italy. If you are not a subscriber, please feel free to subscribe
here
|
|
|
|
|
|
DNV offers tools for Wholesale Market analysis and operation:
- DNV Power Analytics (DNV-PA) is our web-based platform that provides access to constantly updated long-term energy price forecasts.
- With a refined design and an improved user experience we are upgrading our digital services for our customers.
|
|
|
|
|
|
|
Puerto Montt price falls to zero for 32 hours during two days driven by high renewable generation and grid congestion
|
|
|
|
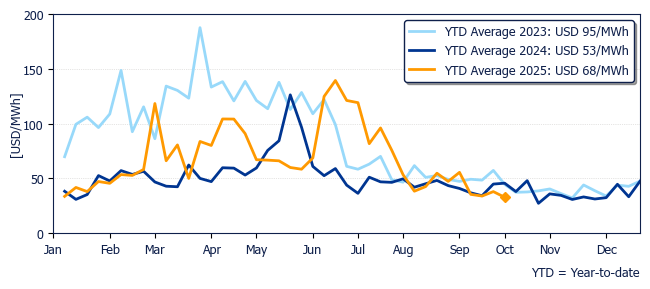
The average price in Polpaico was USD 32.8/MWh, 28% lower than one year ago and 14% lower compared to last week.
|
|
Marginal cost evolution in Polpaico during past years
|
|
|
|
|
|
|
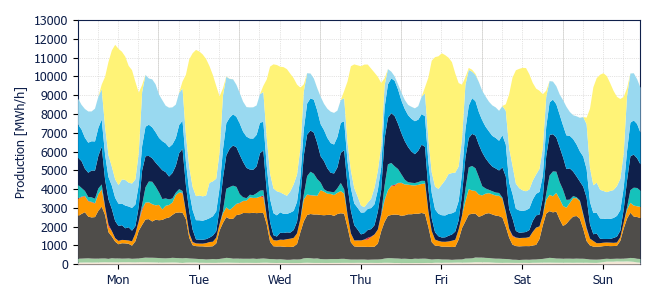
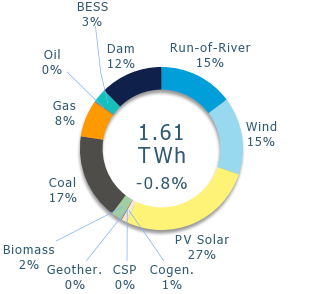
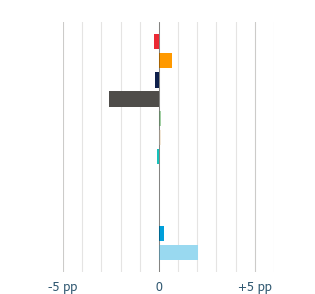
Thermal participation declined notably, with coal down 2.6 pp. and oil down 0.3 pp., followed by dam participation slightly down 0.2 pp. These reductions were offset by higher wind (+2.0 pp) and gas (+0.7 pp) participation, while solar remained stable compared to the previous week.
|
|
Generation Mix
|
|
|
|
|
Variation
|
|
|
|
|
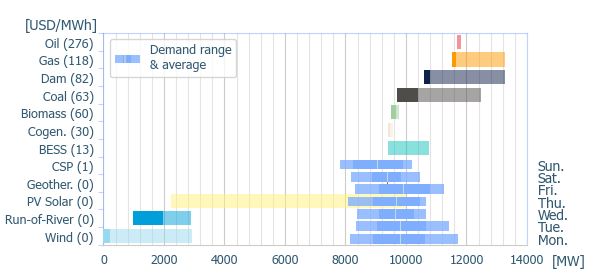
Power range by energy sources (average prices)
|
|
|
|
|
|
|
|
|
|
|
|
|
|
Geothermal
|
|
Cogeneration
|
|
Biomass
|
|
Coal
|
|
|
Gas
|
|
Oil
|
|
BESS
|
|
Dam
|
|
|
Run-of-river
|
|
Wind
|
|
PV Solar
|
|
CSP
|
|
|
|
|
|
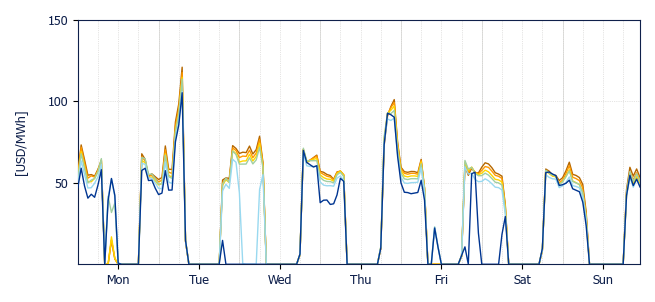
Spot prices fell to zero every day this week.
|
|
In the Puerto Montt zone, prices were zero during 32 hours from Tuesday morning to Wednesday afternoon, except Tuesday at 7 PM. This was driven by high renewable availability, with strong wind, dam, and run-of-river generation. Transmission congestion on the 220 kV Charrúa – Santa Clara line limited northward flows, causing local price decoupling. A similar situation occurred on Friday, though for fewer hours.
|
|
Additionally, the 500 kV line experienced congestion on Monday, Friday, and Saturday, particularly along the Nueva Pan de Azúcar – Polpaico and Alto Jahuel – Lo Aguirre sections.
|
|
The system peak demand occurred on Monday at 12 PM, reaching 11.7 GW, with wind and solar contributing 69.6% of total generation at that time. The peak price was reached in the Crucero zone on Tuesday morning at 7 AM.
|
|
|
|
|
|
|
Crucero
USD 33.7/MWh
|
|
D. de Almagro
USD 33.0/MWh
|
|
Pan de Azúcar
USD 32.3/MWh
|
|
|
|
|
Polpaico
USD 32.8/MWh
|
|
Charrúa
USD 29.2/MWh
|
|
Puerto Montt
USD 23.0/MWh
|
|
|
|
|
|
Solar and Wind production & BESS dispatch
|
|
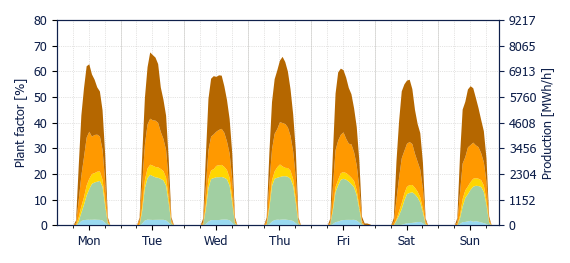
Solar generation remained stable at 439 GWh, with a system plant factor of 22.5% and maximum injections reaching 7.8 GW Tuesday at 12 PM.
|
|
On Tuesday, solar output was particularly strong in the Charrúa zone, achieving an average plant factor of 28.5%. Solar production increased highest in Crucero (+5.8 GWh | +3.5%) and decreased most in Pan de Azúcar (-5.0 GWh | -16.3%).
|
|
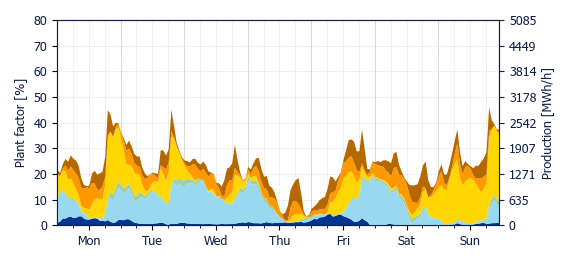
Wind generation increased by 14% week-on-week, reaching 248 GWh. The system plant factor was 23.2%, with maximum injections of 2.9 GW Sunday at 8 PM.
|
|
Wind production increased significantly in Charrúa (+40.7 GWh | +111.4%), reflecting higher regional wind availability.
|
|
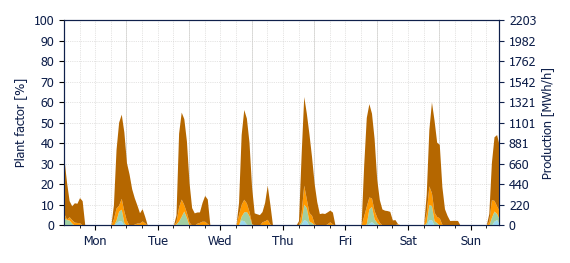
BESS injections totaled 45.8 GWh, remaining unchanged compared to last week. Maximum injections reached 1.4 GW Thursday at 9 PM. The Crucero zone accounted for the majority of this activity, with 37.3 GWh, representing 81% of total injections.
|
|
This week’s curtailment rate was 12.3% for wind and 17.5% for solar, resulting in an average rate of 15.4%, similar to the previous week. Note: Curtailment volumes were calculated excluding data from 1 October, which was not available at the time of publication.
|
|
|
|
|
|
|
|
|
|
|
|
|
|
|
|
|
Crucero
USD 1.4/MWh
|
|
D. de Almagro
USD 1.6/MWh
|
|
Pan de Azúcar
USD 1.2/MWh
|
|
|
|
|
Polpaico
USD 2.2/MWh
|
|
Charrúa
USD 3.5/MWh
|
|
Puerto Montt
USD 2.2/MWh
|
|
|
|
|
Energy weighted average spot price using PV production by zone
|
|
|
|
|
|
|
Crucero
USD 30.7/MWh
|
|
D. de Almagro
USD 24.4/MWh
|
|
Pan de Azúcar
USD 34.2/MWh
|
|
|
|
|
Polpaico
USD 43.6/MWh
|
|
Charrúa
USD 33.7/MWh
|
|
Puerto Montt
USD 26.8/MWh
|
|
|
|
|
Energy weighted average spot price using wind production by zone
|
|
|
|
BESS discharge capture price
|
|
|
|
|
Crucero
USD 62.3/MWh
|
|
D. de Almagro
USD 61.1/MWh
|
|
Pan de Azúcar
USD 60.5/MWh
|
|
|
|
|
Polpaico
USD 62.5/MWh
|
|
Charrúa
USD 59.7/MWh
|
|
|
|
|
Energy weighted average spot price using BESS injection by zone
|
|
|
|
|
|
DNV, Magdalena 181, Las Condes, Santiago, Chile
|
|
|
|
|
|
|