|
|
VOL 12 | NUM 1 | 25 July 2025
|
|
|
|
|
|
|
|
CHILE | 14 - 20 July 2025
|
|
|
|
Power Markets Weekly
is a brief weekly review of the electric market operation in Chile, Mexico, Iberia, France and Italy. If you are not a subscriber, please feel free to subscribe
here
|
|
|
|
|
|
DNV offers tools for Wholesale Market analysis and operation:
- DNV Power Analytics (DNV-PA) is our web-based platform that provides access to constantly updated long-term energy price forecasts.
- With a refined design and an improved user experience we are upgrading our digital services for our customers.
|
|
|
|
|
|
|
Volume 12 kicks off with congestion-driven prices
|
|
|
|
As we begin Volume 12 of our weekly market insights, we want to take a moment to thank our readers for your continued engagement and trust. Your interest and feedback have shaped this journey, and we’re excited to keep delivering value as the energy landscape evolves.
|
|
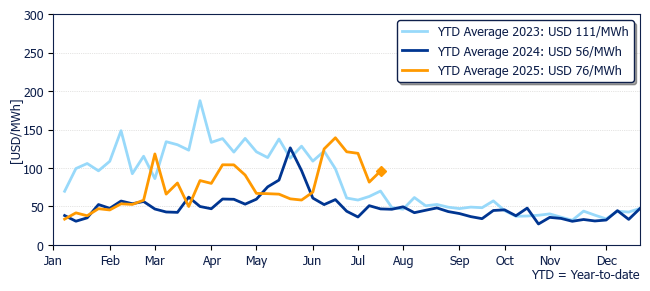
The average price at Polpaico was USD 96.0/MWh, 18% higher than last week and 105% higher than the same week last year.
|
|
Marginal cost evolution in Polpaico during past years
|
|
|
|
|
|
|
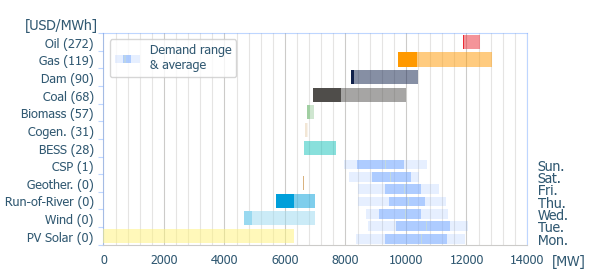
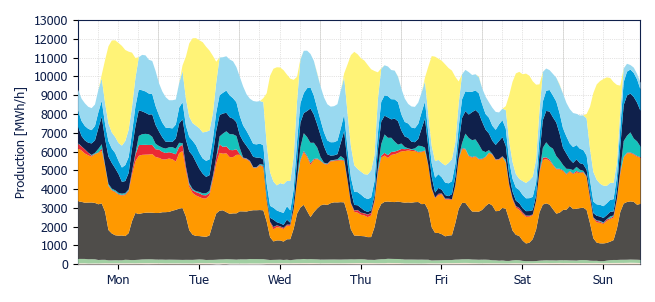
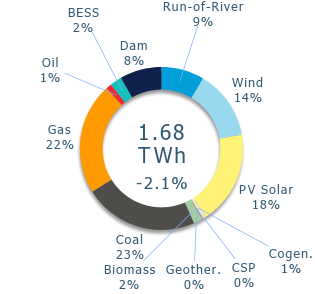
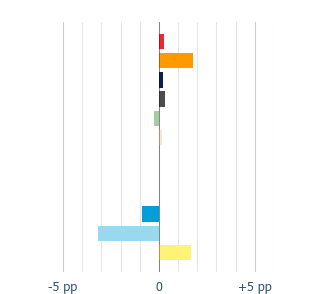
Renewables reduced their share in the energy mix, mainly driven by drops in wind and run-of-river. Wind dropped by 3.2 percentage points (pp.), and run-of-river by 0.9 pp. Meanwhile, solar and dam increased their shares by 1.7 pp. and 0.2 pp., respectively. The increase in thermal participation was led by gas, which raised its share in the mix by 1.8 pp.
|
|
The system’s maximum demand reached 12.1 GW on Tuesday at 11 AM, with wind, solar, and BESS contributing 47.7% of the output. The highest wind-solar-BESS participation occurred on Wednesday at 1 PM, covering 73.4% of the 10.4 GW demand. With Wednesday being a holiday in Chile, weekly demand dipped 2.1% compared to the previous week.
|
|
Generation Mix
|
|
|
|
|
Variation
|
|
|
|
|
Power range by energy sources (average prices)
|
|
|
|
|
|
|
|
|
|
|
|
|
|
Geothermal
|
|
Cogeneration
|
|
Biomass
|
|
Coal
|
|
|
Gas
|
|
Oil
|
|
BESS
|
|
Dam
|
|
|
Run-of-river
|
|
Wind
|
|
PV Solar
|
|
CSP
|
|
|
|
|
|
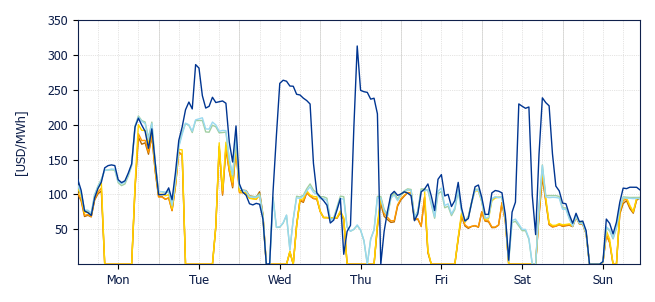
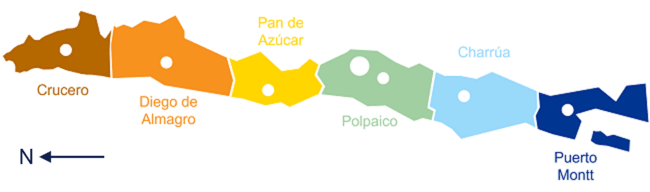
This week, the system experienced recurrent congestion in both the north and the south. In the north, congestion on the 500 kV line Nueva Pan de Azúcar - Polpaico decoupled northern nodes pricewise, making it common to see prices of USD 0/MWh during solar hours in northern nodes while the rest of the system sustained higher prices.
|
|
Conversely, in the Puerto Montt zone, congestion on the 220 kV line Lastarria - Ciruelos (Wednesday and Saturday) and the 220 kV line Río Malleco - Cautín (Thursday) led to oil power plants setting the price for several hours during the week. The peak marginal price among reference nodes was set on Thursday at 11 AM, reaching USD 312.8/MWh in Puerto Montt.
|
|
|
|
|
|
|
Crucero
USD 54.9/MWh
|
|
D. de Almagro
USD 55.4/MWh
|
|
Pan de Azúcar
USD 59.9/MWh
|
|
|
|
|
Polpaico
USD 96.0/MWh
|
|
Charrúa
USD 95.9/MWh
|
|
Puerto Montt
USD 129.1/MWh
|
|
|
|
|
|
Solar and Wind production & BESS dispatch
|
|
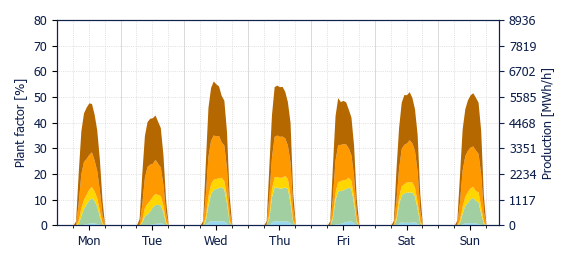
Solar generation increased by 21.8 GWh (+7.5%) this week, with a system-wide average plant factor of 16.6%. The highest solar plant factor was observed in Crucero (19.5%), while the lowest was in Puerto Montt (7.5%).
|
|
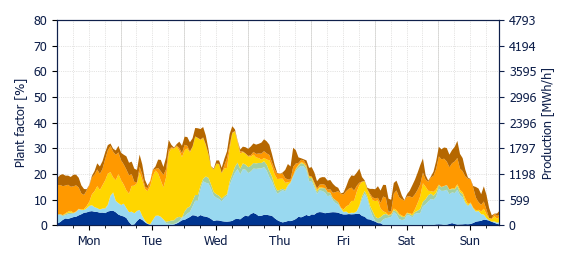
Conversely, wind generation declined by 59.7 GWh (-20.5%). The average system plant factor was 23.0%, with Puerto Montt leading at 38.8% and Diego de Almagro recording the lowest at 18.3%.
|
|
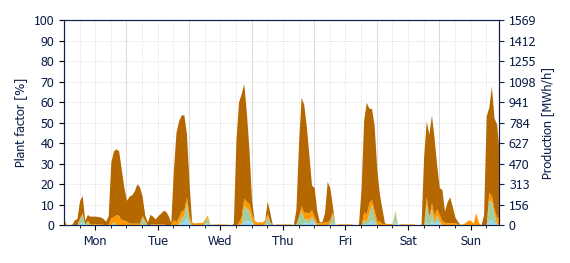
BESS discharges totaled 39.4 GWh, falling short of last week’s output by 0.7 GWh (-1.6%). The average BESS plant factor was 14.9%, peaking in the Crucero zone at 17.3%, and reaching a low of 7.0% in Pan de Azúcar.
|
|
This week, solar curtailment reached 12.3%, up by 1.9 pp. from the previous week. Wind curtailment rose to 5.9%, up by 1.7 pp. The combined curtailment rate was 9.7%, 2.2 pp. higher than last week.
|
|
|
|
|
|
|
|
|
|
|
|
|
|
|
|
|
Crucero
USD 5.1/MWh
|
|
D. de Almagro
USD 4.2/MWh
|
|
Pan de Azúcar
USD 3.5/MWh
|
|
|
|
|
Polpaico
USD 71.9/MWh
|
|
Charrúa
USD 67.2/MWh
|
|
Puerto Montt
USD 169.7/MWh
|
|
|
|
|
Energy weighted average spot price using PV production by zone
|
|
|
|
|
|
|
Crucero
USD 57.7/MWh
|
|
D. de Almagro
USD 54.5/MWh
|
|
Pan de Azúcar
USD 77.8/MWh
|
|
|
|
|
Polpaico
USD 84.2/MWh
|
|
Charrúa
USD 79.9/MWh
|
|
Puerto Montt
USD 118.9/MWh
|
|
|
|
|
Energy weighted average spot price using wind production by zone
|
|
|
|
BESS discharge capture price
|
|
|
|
|
Crucero
USD 89.0/MWh
|
|
D. de Almagro
USD 76.8/MWh
|
|
Pan de Azúcar
USD 91.8/MWh
|
|
|
|
|
Polpaico
USD 107.3/MWh
|
|
Charrúa
USD 105.6/MWh
|
|
|
|
|
Energy weighted average spot price using BESS injection by zone
|
|
|
|
|
|
DNV, Magdalena 181, Las Condes, Santiago, Chile
|
|
|
|
|
|
|