|
|
VOL 11 | NUM 50 | 4 July 2025
|
|
|
|
|
|
|
|
CHILE | 23 - 29 June 2025
|
|
|
|
Power Markets Weekly
is a brief weekly review of the electric market operation in Chile, Mexico, Iberia, France and Italy. If you are not a subscriber, please feel free to subscribe
here
|
|
|
|
|
|
DNV offers tools for Wholesale Market analysis and operation:
- DNV Power Analytics (DNV-PA) is our web-based platform that provides access to constantly updated long-term energy price forecasts.
- With a refined design and an improved user experience we are upgrading our digital services for our customers.
|
|
|
|
|
|
|
Limitations on 500 kV line Nueva Pan de Azúcar - Polpaico continued, decoupling the system between Pan de Azúcar and Polpaico.
|
|
|
|
[Note: At the time of redaction of this weekly report, marginal costs of Saturday weren’t available after 6 AM. As a consequence, that period wasn't considered when calculating average or captured prices]
|
|
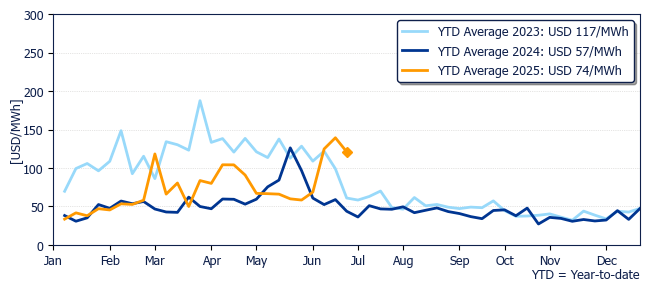
Polpaico average marginal price was USD 121.1/MWh, which is 13% lower than last week and 177% higher than the same week last year.
|
|
Marginal cost evolution in Polpaico during past years
|
|
|
|
|
|
|
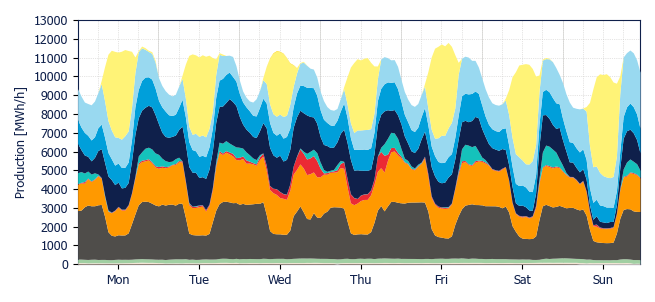
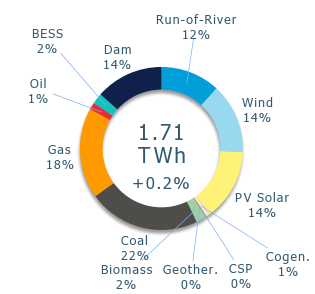
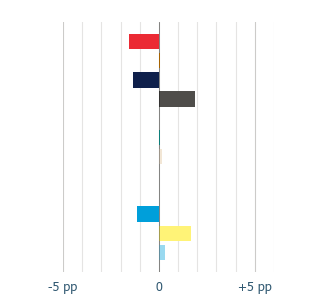
In terms of the generation mix, hydro sources and oil reduced their participation: dam by 1.4 pp., run-of-river by 1.1 pp. and oil by 1.6 pp. On the other hand, the increases were given by coal (+1.9 pp.), solar (+1.7 pp.) and a minor increase in wind (+0.3 pp.).
|
|
It is important to note that last week, gas participation decreased due to transmission limitations and some unavailability. Although these constraints have lessened, they still seem to affect gas participation, which remained unchanged.
|
|
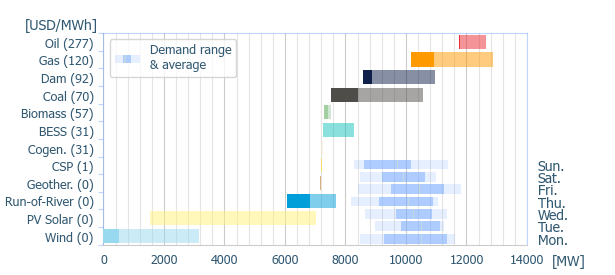
This week, average variable cost of dam remained high at USD 92/MWh (only USD 3/MWh lower than last week). The low water availability reflected on depletion declarations by dams Pehuenche, Ralco and Rapel at various times throughout the week.
|
|
Peak demand was seen on Friday at 2 PM reaching 11.8 GWh/h. At the time, solar and wind accounted for 38.5% and 13.0% of the generation mix, respectively.
|
|
Generation Mix
|
|
|
|
|
Variation
|
|
|
|
|
Power range by energy sources (average prices)
|
|
|
|
|
|
|
|
|
|
|
|
|
|
Geothermal
|
|
Cogeneration
|
|
Biomass
|
|
Coal
|
|
|
Gas
|
|
Oil
|
|
BESS
|
|
Dam
|
|
|
Run-of-river
|
|
Wind
|
|
PV Solar
|
|
CSP
|
|
|
|
|
|
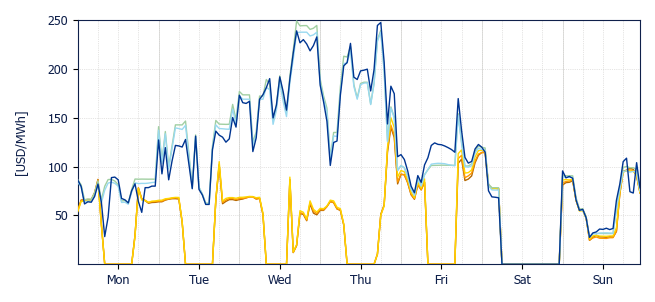
500 kV line Nueva Pan de Azúcar – Polpaico kept operating with the restrictions of last week, leading to a system that was mostly decoupled between Pan de Azúcar and Polpaico, increasing prices between the center and south. Peak marginal cost occured on Wednesday at 4 PM, reaching USD 249.1/MWh in Polpaico. The line's limitation was resolved on Thursday afternoon, when the second circuit returned to normal operation. While Saturday prices were unavailable, Sunday showed a coupled system.
|
|
There were also congestions in 220 kV Charrúa – Santa Clara on some hours of Monday and Sunday, decoupling Puerto Montt.
|
|
|
|
|
|
|
Crucero
USD 48.4/MWh
|
|
D. de Almagro
USD 48.7/MWh
|
|
Pan de Azúcar
USD 49.6/MWh
|
|
|
|
|
Polpaico
USD 121.1/MWh
|
|
Charrúa
USD 118.5/MWh
|
|
Puerto Montt
USD 119.3/MWh
|
|
|
|
|
|
Solar and Wind production & BESS dispatch
|
|
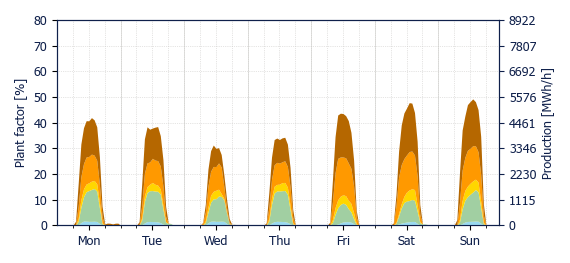
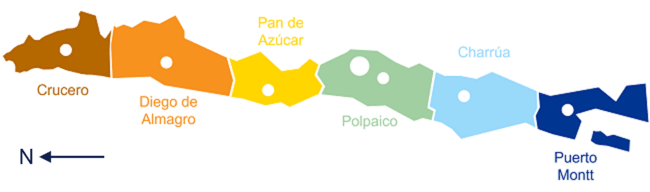
Solar generation increased this week by 13.5% (+29.1 GWh). The average plant factor was similar in most regions: between 13.1% in Pan de Azúcar and 13.9% in Crucero area. Exceptions were Polpaico and Puerto Montt areas that had plant factors of 11.7% and 6.4%, respectively. In total, the average solar plant factor in the system was of 13.0%.
|
|
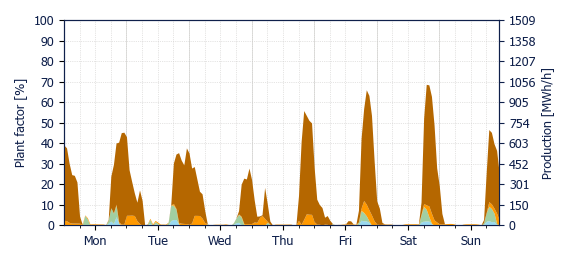
Wind generation was stable, only a 2.5% increase (+5.8 GWh). The highest average plant factor was seen in Cardones area with 29.7% and the lowest was on Charrúa with 16.9%. In total, the average wind plant factor in the system was of 23.6%.
|
|
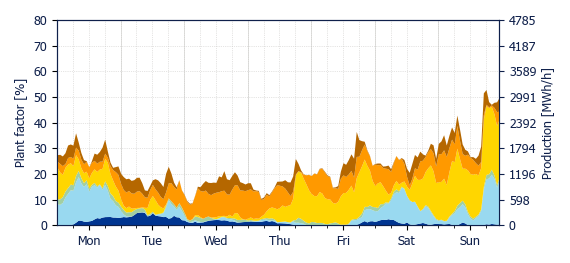
Finally, BESS injections were also stable (+2.3%|+0.8 GWh). The highest plant factor was in Crucero (17.6%) while the lowest was at Pan de Azúcar (5.8%). In total average BESS plant factor was of 14.5%.
|
|
This week’s curtailment rate was 7.8% for wind and 21.1% for solar, reaching a mixed average curtailment rate of 14.6% (lower than last week’s average curtailment rate of 21.8%).
|
|
|
|
|
|
|
|
|
|
|
|
|
|
|
|
|
Crucero
USD 9.4/MWh
|
|
D. de Almagro
USD 7.9/MWh
|
|
Pan de Azúcar
USD 7.7/MWh
|
|
|
|
|
Polpaico
USD 109/MWh
|
|
Charrúa
USD 108.7/MWh
|
|
Puerto Montt
USD 100.8/MWh
|
|
|
|
|
Energy weighted average spot price using PV production by zone
|
|
|
|
|
|
|
Crucero
USD 44/MWh
|
|
D. de Almagro
USD 49.2/MWh
|
|
Pan de Azúcar
USD 60.7/MWh
|
|
|
|
|
Polpaico
USD 113.2/MWh
|
|
Charrúa
USD 85.5/MWh
|
|
Puerto Montt
USD 119.1/MWh
|
|
|
|
|
Energy weighted average spot price using wind production by zone
|
|
|
|
BESS discharge capture price
|
|
|
|
|
Crucero
USD 79.1/MWh
|
|
D. de Almagro
USD 69.9/MWh
|
|
Pan de Azúcar
USD 90.3/MWh
|
|
|
|
|
Polpaico
USD 124.7/MWh
|
|
Charrúa
USD 118.3/MWh
|
|
|
|
|
Energy weighted average spot price using BESS injection by zone
|
|
|
|
|
|
DNV, Magdalena 181, Las Condes, Santiago, Chile
|
|
|
|
|
|
|