|
|
VOL 11 | NUM 34 | 14 March 2025
|
|
|
|
Power Markets Weekly
is a brief weekly review of the electric market operation in Chile, Mexico, Iberia, France and Italy. If you are not a subscriber, please feel free to subscribe
here
|
|
|
|
|
|
DNV offers tools for Wholesale Market analysis and operation:
- DNV Power Analytics (DNV-PA) is our web-based platform that provides access to constantly updated long-term energy price forecasts.
- With a refined design and an improved user experience we are upgrading our digital services for our customers.
|
|
|
|
|
|
|
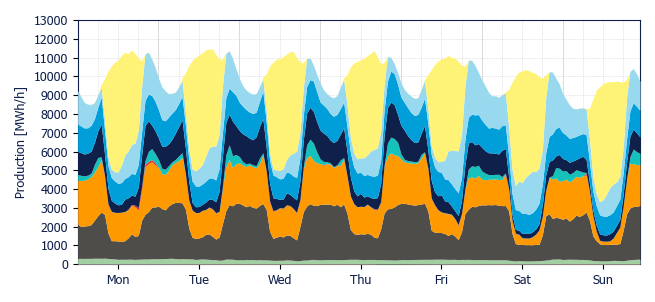
Operational limitations result in increases in both thermal participation and curtailment.
|
|
|
|
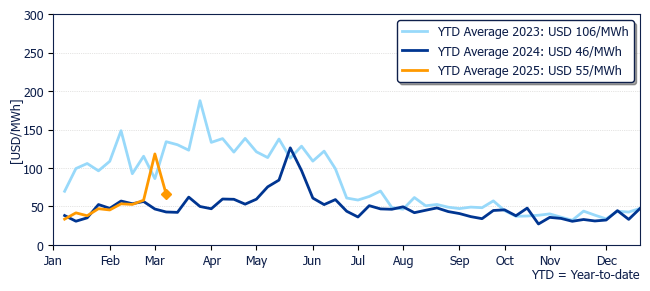
Average price of Polpaico was 44% lower than last week, but 12% higher than the week prior to the blackout. Compared to last year’s same week, it was 54% higher.
|
|
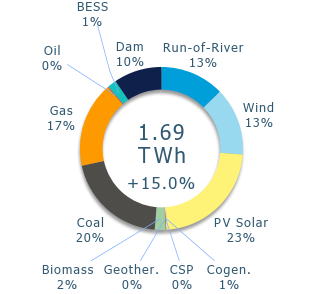
Demand values returned to pre-blackout levels, reaching 1.7 TWh.
|
|
Marginal cost evolution in Polpaico during past years
|
|
|
|
|
|
|
Due to last week’s blackout, the Chilean System Operator (CEN) restricted the operational capacity of the affected 500 kV line “Nueva Maitencillo – Nueva Pan de Azúcar” and the 220 kV corridor “Maitencillo – Pan de Azúcar,” capping their combined flow around 800 MW. This limitation reduced transmission from northern areas to the center, affecting the generation mix and curtailment.
|
|
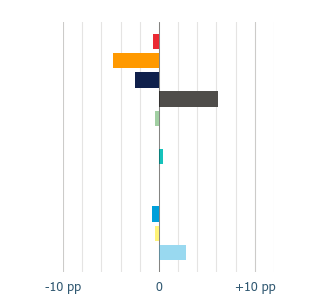
Solar generation decreased by 0.4 pp. compared to last week, and by 4.1 pp. compared to the week before the blackout.
|
|
This change impacted thermal sources: compared to last week, gas and oil participation decreased by 4.8 pp. and 0.6 pp., respectively, while coal increased by 6.1 pp. Compared to the week before the blackout, coal's share increased by 2.7 pp. and gas by 0.7 pp.
|
|
Wind generation increased its participation by 2.8 pp. this week and by 1.5 pp. compared to the week before the blackout.
|
|
Considering the importance of flexibility in the system and the contribution of dam power plants to this, it's an important news that after some weeks under tests, Los Cóndores power plant (dam) of 153 MW, located on the Maule region, has officialy started its operation this week.
|
|
Generation Mix
|
|
|
|
|
Variation
|
|
|
|
|
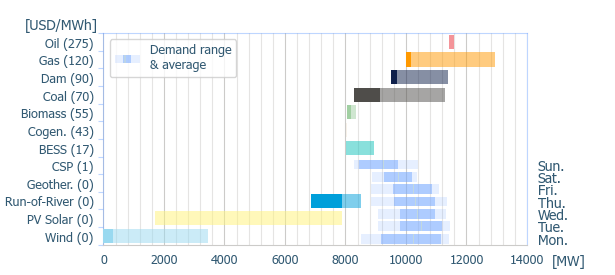
Power range by energy sources (average prices)
|
|
|
|
|
|
|
|
|
|
|
|
Geothermal
|
|
Cogeneration
|
|
Biomass
|
|
Coal
|
|
|
Gas
|
|
Oil
|
|
BESS
|
|
Dam
|
|
|
Run-of-river
|
|
Wind
|
|
PV Solar
|
|
CSP
|
|
|
|
|
|
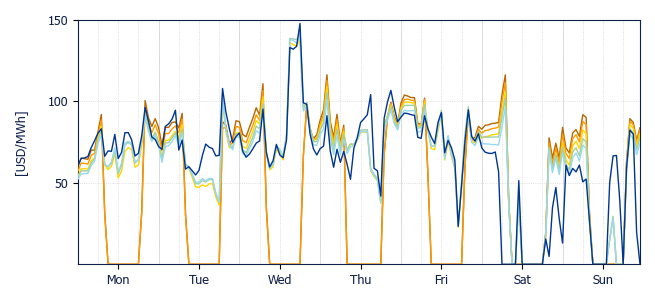
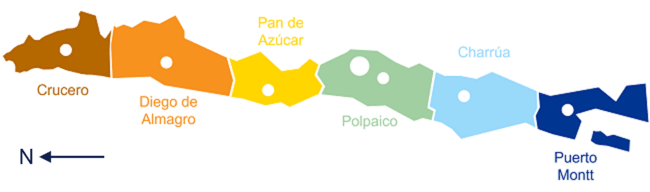
Given the transmission restrictions on the 500 kV line Nueva Pan de Azúcar - Nueva Maitencillo, prices dropped to USD 0/MWh north of Pan de Azúcar during solar hours throughout the week, while no zero prices were observed from Pan de Azúcar to the south on working days.
|
|
Over the weekend, prices dropped to USD 0/MWh across the entire system during most solar hours. Additionally, Puerto Montt experienced some decoupling on Tuesday and Sunday due to congestion on the 220 kV line Lastarria – Ciruelos.
|
|
|
|
|
|
|
Crucero
USD 46.5/MWh
|
|
D. de Almagro
USD 45.1/MWh
|
|
Pan de Azúcar
USD 66.1/MWh
|
|
|
|
|
Polpaico
USD 66.1/MWh
|
|
Charrúa
USD 64.5/MWh
|
|
Puerto Montt
USD 64.3/MWh
|
|
|
|
|
|
Solar and Wind production & BESS dispatch
|
|
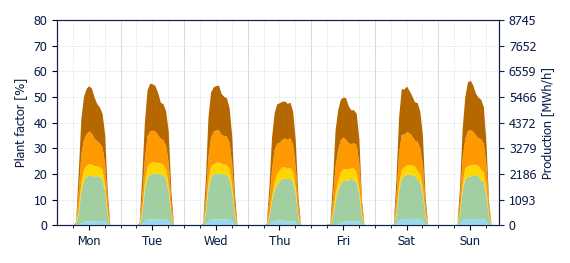
Solar generation increased but remained low, it was 12.4% higher than last week (+42.2 GWh), but 15.2% lower than the week before the blackout (-68.5 GWh). Crucero and Cardones areas had the lowest plant factors of the week, with 20.1% and 17.1% respectively, while the highest was on the Charrúa area, with 29.4%.
|
|
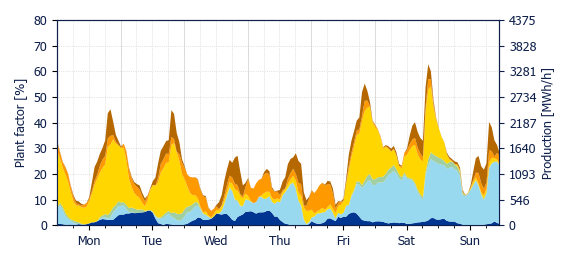
Wind generation in the system was higher this week, by 45.6% (+71.3 GWh). Crucero had the lowest plant factor of 17.2%, while the highest was seen on Charrúa area with 28.7%.
|
|
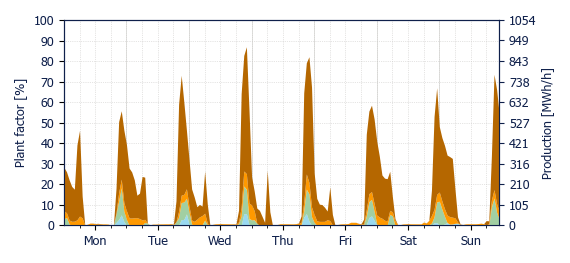
In terms of BESS, their injections were higher than last week by 46.5% (+9.4 GWh). Pan de Azúcar had the lowest plant factor of 7.6%, while the highest was on Cardones with 21.6%.
|
|
This week curtailment rate was 10.3% for wind and 24.1% for solar (22.1 GWh and 103.4 GWh, respectively), with a total average curtailment rate of 19.5% (8.1 pp. higher than the week before the blackout). These values don't include Sunday curtailment information as it wasn't available.
|
|
|
|
|
|
|
|
|
|
|
|
|
|
|
|
|
Crucero
USD 2.7/MWh
|
|
D. de Almagro
USD 3.5/MWh
|
|
Pan de Azúcar
USD 51.1/MWh
|
|
|
|
|
Polpaico
USD 51.9/MWh
|
|
Charrúa
USD 48.1/MWh
|
|
Puerto Montt
USD 46.9/MWh
|
|
|
|
|
Energy weighted average spot price using PV production by zone
|
|
|
|
|
|
|
Crucero
USD 38.2/MWh
|
|
D. de Almagro
USD 57.6/MWh
|
|
Pan de Azúcar
USD 64.3/MWh
|
|
|
|
|
Polpaico
USD 66.3/MWh
|
|
Charrúa
USD 56.4/MWh
|
|
Puerto Montt
USD 69.3/MWh
|
|
|
|
|
Energy weighted average spot price using wind production by zone
|
|
|
|
|
|
|
Crucero
USD 82.9/MWh
|
|
D. de Almagro
USD 69.4/MWh
|
|
Pan de Azúcar
USD 80.3/MWh
|
|
|
|
|
Polpaico
USD 78.9/MWh
|
|
Charrúa
USD 77.4/MWh
|
|
|
|
|
Energy weighted average spot price using BESS production by zone
|
|
|
|
|
|
DNV, Magdalena 181, Las Condes, Santiago, Chile
|
|
|
|
|
|
|