|
|
VOL 11 | NUM 33 | 7 March 2025
|
|
|
|
|
|
|
|
CHILE | 24 February - 2 March 2025
|
|
|
|
Power Markets Weekly
is a brief weekly review of the electric market operation in Chile, Mexico, Iberia, France and Italy. If you are not a subscriber, please feel free to subscribe
here
|
|
|
|
|
|
DNV offers tools for Wholesale Market analysis and operation:
- DNV Power Analytics (DNV-PA) is our web-based platform that provides access to constantly updated long-term energy price forecasts.
- With a refined design and an improved user experience we are upgrading our digital services for our customers.
|
|
|
|
|
|
|
Blackout leaves 99% of Chile in the dark, pushing prices up and showing the importance of a resilient and flexible system.
|
|
|
|
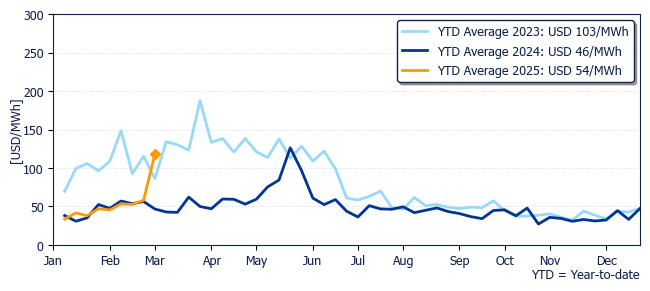
The average price in Polpaico was USD 118.3/MWh, 103% higher than last week and 153% higher compared to one year ago.
|
|
Marginal cost evolution in Polpaico during past years
|
|
|
|
|
|
|
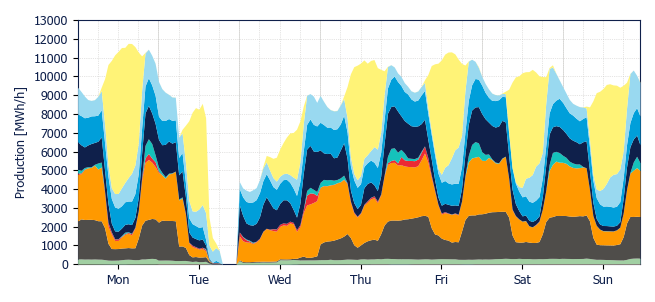
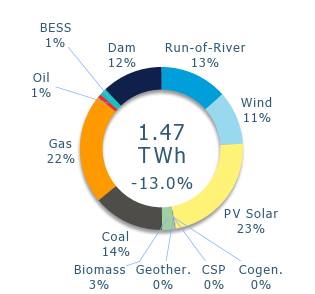
Due to the blackout, demand dropped to 1.47 TWh, 13% lower than last week.
|
|
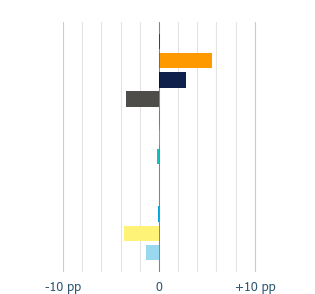
This week gas and dam starred in terms of participation: the first one had an increase of 2.9 pp and the second one rose up by 5.5 pp. Both increases were due to the reliance on those technologies in the days and hours following the system recovery.
|
|
On the other hand, coal, solar, and wind took big losses in their participation: solar went down by 3.7 pp, wind decreased by 1.3 pp, and coal by 3.4 pp. Solar and wind decreases were partly due to stronger transmission limitations after the recovery, while coal reduction was due to the fact coal units took around a day to inject again after the recovery.
|
|
Generation Mix
|
|
|
|
|
Variation
|
|
|
|
|
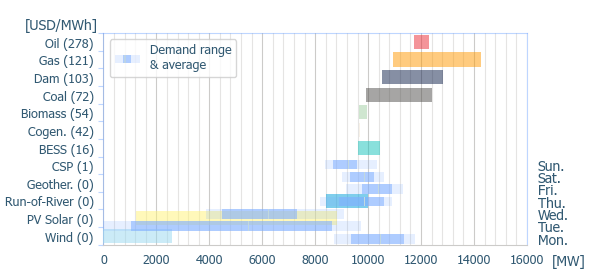
Power range by energy sources (average prices)
|
|
|
|
|
|
|
|
|
|
|
|
Geothermal
|
|
Cogeneration
|
|
Biomass
|
|
Coal
|
|
|
Gas
|
|
Oil
|
|
BESS
|
|
Dam
|
|
|
Run-of-river
|
|
Wind
|
|
PV Solar
|
|
CSP
|
|
|
|
|
|
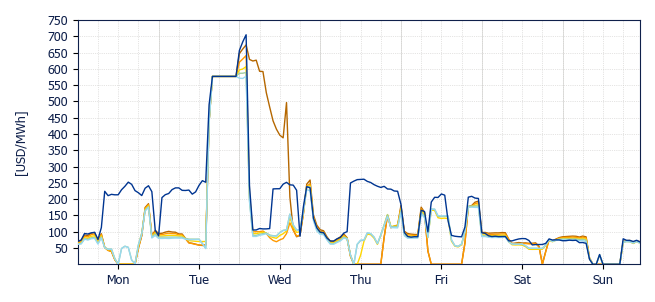
This week the main event was the blackout on Tuesday. At 15:15, a failure in the 500 kV line Nueva Maitencillo - Nueva Pan de Azúcar took the whole system down, leaving 98.9% of Chile without electricity. Once that failure was solved, according to the ISO, failures in Transelec SCADA rendered a fast reconnection impossible.
|
|
The whole system was back again after more than 10 hours and many efforts, although it took until Thursday to resume usual demand levels. Dam amd gas plants played a key role in the recovery of the SEN.
|
|
From Friday onward, the CEN started limiting the power flow through the lines that caused the blackout.This limitation caused curtailment to increase without droping prices to zero, thus resulting in higher solar prices overall.
|
|
The event rose the prices to a maximum of USD 704.6 MWh (shortage price).
|
|
|
|
|
|
|
Crucero
USD 139.9/MWh
|
|
D. de Almagro
USD 107.3/MWh
|
|
Pan de Azúcar
USD 117.0/MWh
|
|
|
|
|
Polpaico
USD 118.3/MWh
|
|
Charrúa
USD 116.4/MWh
|
|
Puerto Montt
USD 174.1/MWh
|
|
|
|
|
|
Solar and Wind production & BESS dispatch
|
|
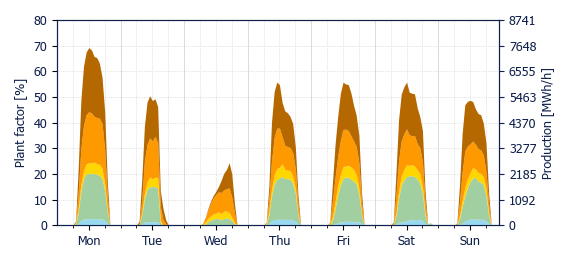
Solar generation went down with a total of 339.6 GWh, 25% lower than last week. The average plant factor was 18.6%, being the highest in Charrúa (25.1%) and lowest in Puerto Montt (14.1%).
|
|
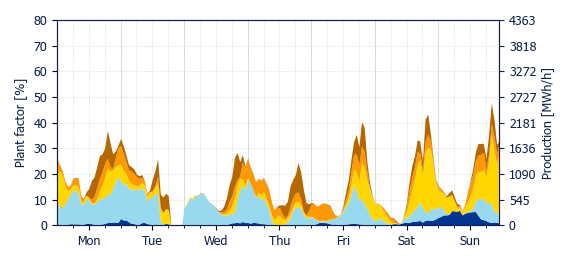
Wind generation also decreased with a total of 156.4 GWh, 23% lower than last week. The average plant factor was 17.1%, being the highest in Charrúa (21.9%) and the lowest in Polpaico (4.1%).
|
|
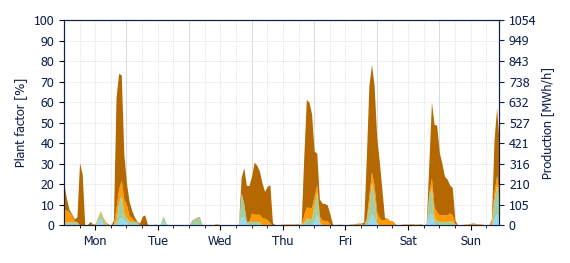
BESS discharged a total of 20.3 GWh, 22% lower than last week. The average plant factor was 11.5%, being the highest in Diego de Almagro (16.4%) and the lowest in Pan de Azúcar (5.1%)
|
|
This week’s curtailment rate was 14.9% for wind and 19.8% for solar, reaching an average curtailment rate of 18.4%, meaning that 131.2 GWh of renewable energy were lost due to the curtailment. These values are computed from reductions available in CEN's daily summaries.
|
|
|
|
|
|
|
|
|
|
|
|
|
|
|
|
|
Crucero
USD 37.4/MWh
|
|
D. de Almagro
USD 35.0/MWh
|
|
Pan de Azúcar
USD 59.3/MWh
|
|
|
|
|
Polpaico
USD 60.1/MWh
|
|
Charrúa
USD 53.3/MWh
|
|
Puerto Montt
USD 138.7/MWh
|
|
|
|
|
Energy weighted average spot price using PV production by zone
|
|
|
|
|
|
|
Crucero
USD 97.8/MWh
|
|
D. de Almagro
USD 68.4/MWh
|
|
Pan de Azúcar
USD 88.6/MWh
|
|
|
|
|
Polpaico
USD 97.7/MWh
|
|
Charrúa
USD 97.0/MWh
|
|
Puerto Montt
USD 90.9/MWh
|
|
|
|
|
Energy weighted average spot price using wind production by zone
|
|
|
|
|
|
|
Crucero
USD 117.5/MWh
|
|
D. de Almagro
USD 91.6/MWh
|
|
Pan de Azúcar
USD 184.6/MWh
|
|
|
|
|
Polpaico
USD 127.7/MWh
|
|
Charrúa
USD 116.9/MWh
|
|
|
|
|
Energy weighted average spot price using BESS production by zone
|
|
|
|
|
|
DNV, Magdalena 181, Las Condes, Santiago, Chile
|
|
|
|
|
|
|