Power Markets Weekly - Chile
Every week, we prepare a brief weekly review of the electric market operation in Chile, Mexico, Iberia, Italy and France. Subscribe to our weekly review of the electric market operation to stay updated.
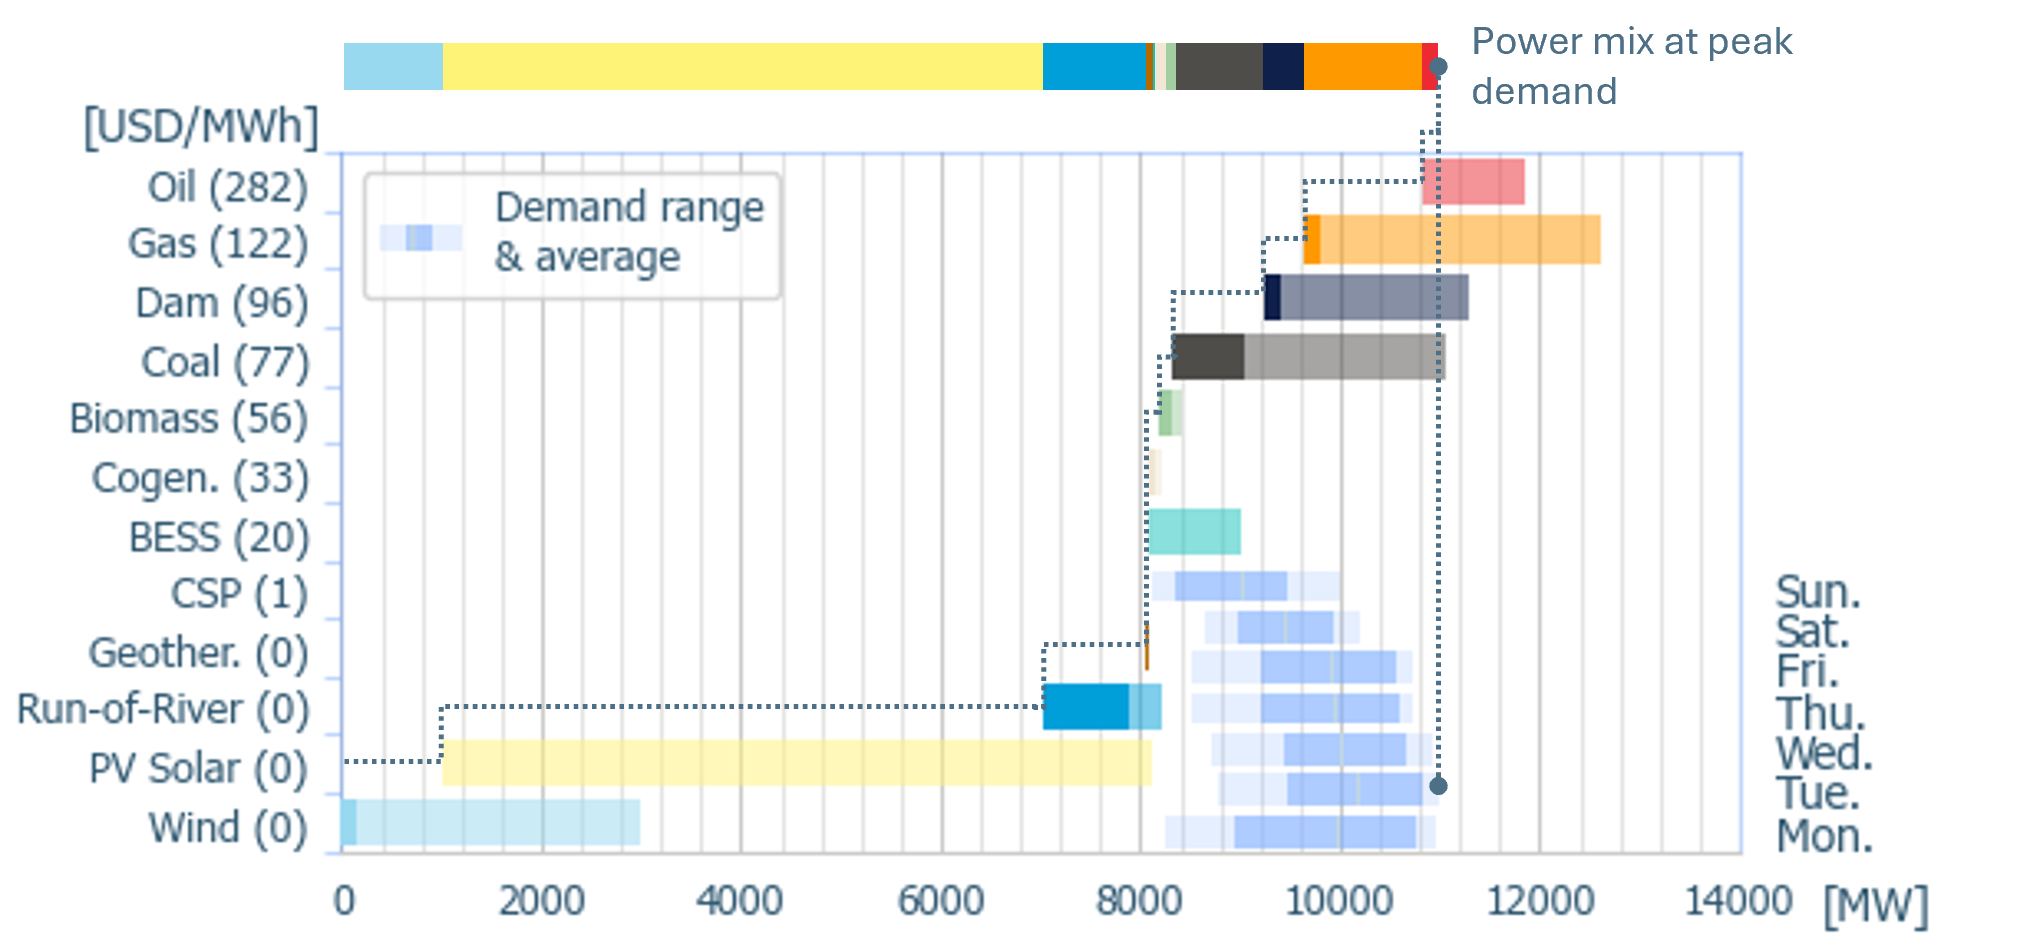
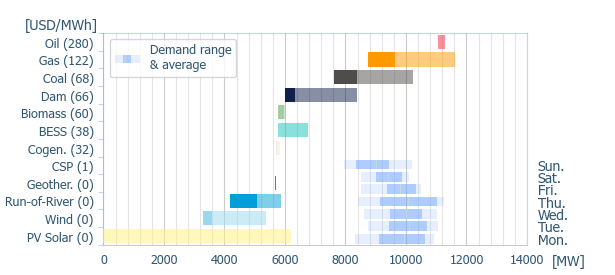
This page explains the meaning of each element featured in the "Power range by energy source" chart, which is included in every edition of the weekly report. The chart shows the production range of each technology throughout the week, as well as the daily demand range.
Demand ranges
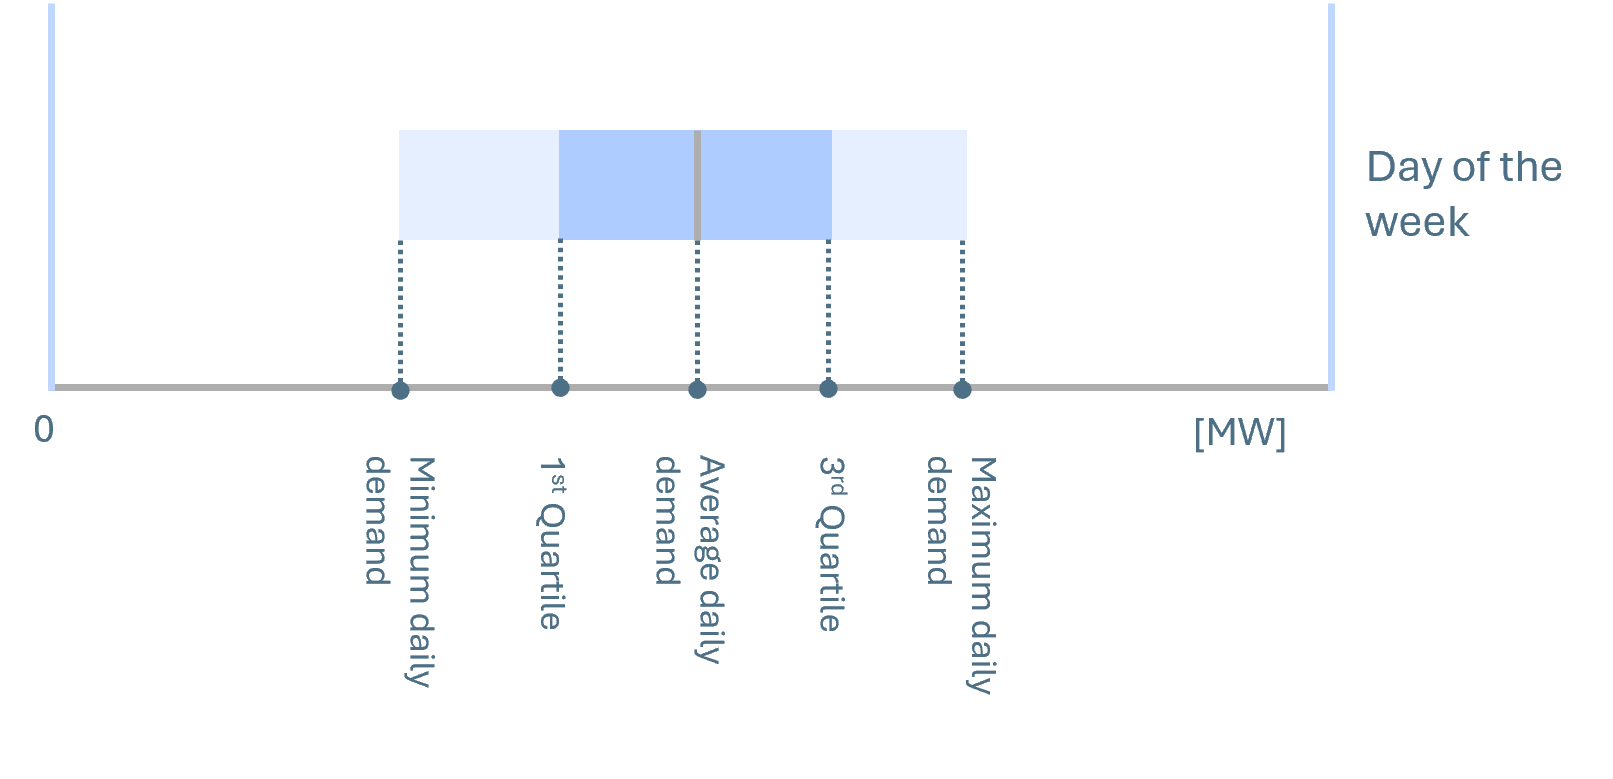
Demand is represented by boxes that display the maximum and minimum values, along with quartiles and average markers.
Generation ranges
Generation technologies are illustrated with power bars. Each bar starts at the previous technology's generation power during the hour of peak demand. The length of the dark section indicates the minimum dispatch, while the length of the entire bar indicates the maximum dispatch. Lastly, the order of the technologies in the vertical axis is defined by their variable cost.
By looking at both parts of the graph (demand and generation), one can understand the power mix during the hour of maximum demand in the week.